

Datadog
Overview
Datadog is the monitoring and analytics platform for cloud applications, unifying metrics, logs, and traces for full-stack observability. To leverage this power, the Storefront Hosting platform makes it easy to export your monitoring data to Datadog, unlocking its full potential. This out-of-the-box integration instantly provides real-time performance monitoring and support through alerting, ensuring you can proactively troubleshoot and maintain a high-performance shopping experience for your business.
To learn more about Datadog, visit their official documentation center.
Set Up
When adding the Datadog exporter, you need to fill in two fields:
- Address: This needs to be a pointer to the correct Datadog instance, such as
datadoghq.eufor EU customers. - API Key: This is the Datadog API key. Find out how to easily locate or create the API key for your organization here.
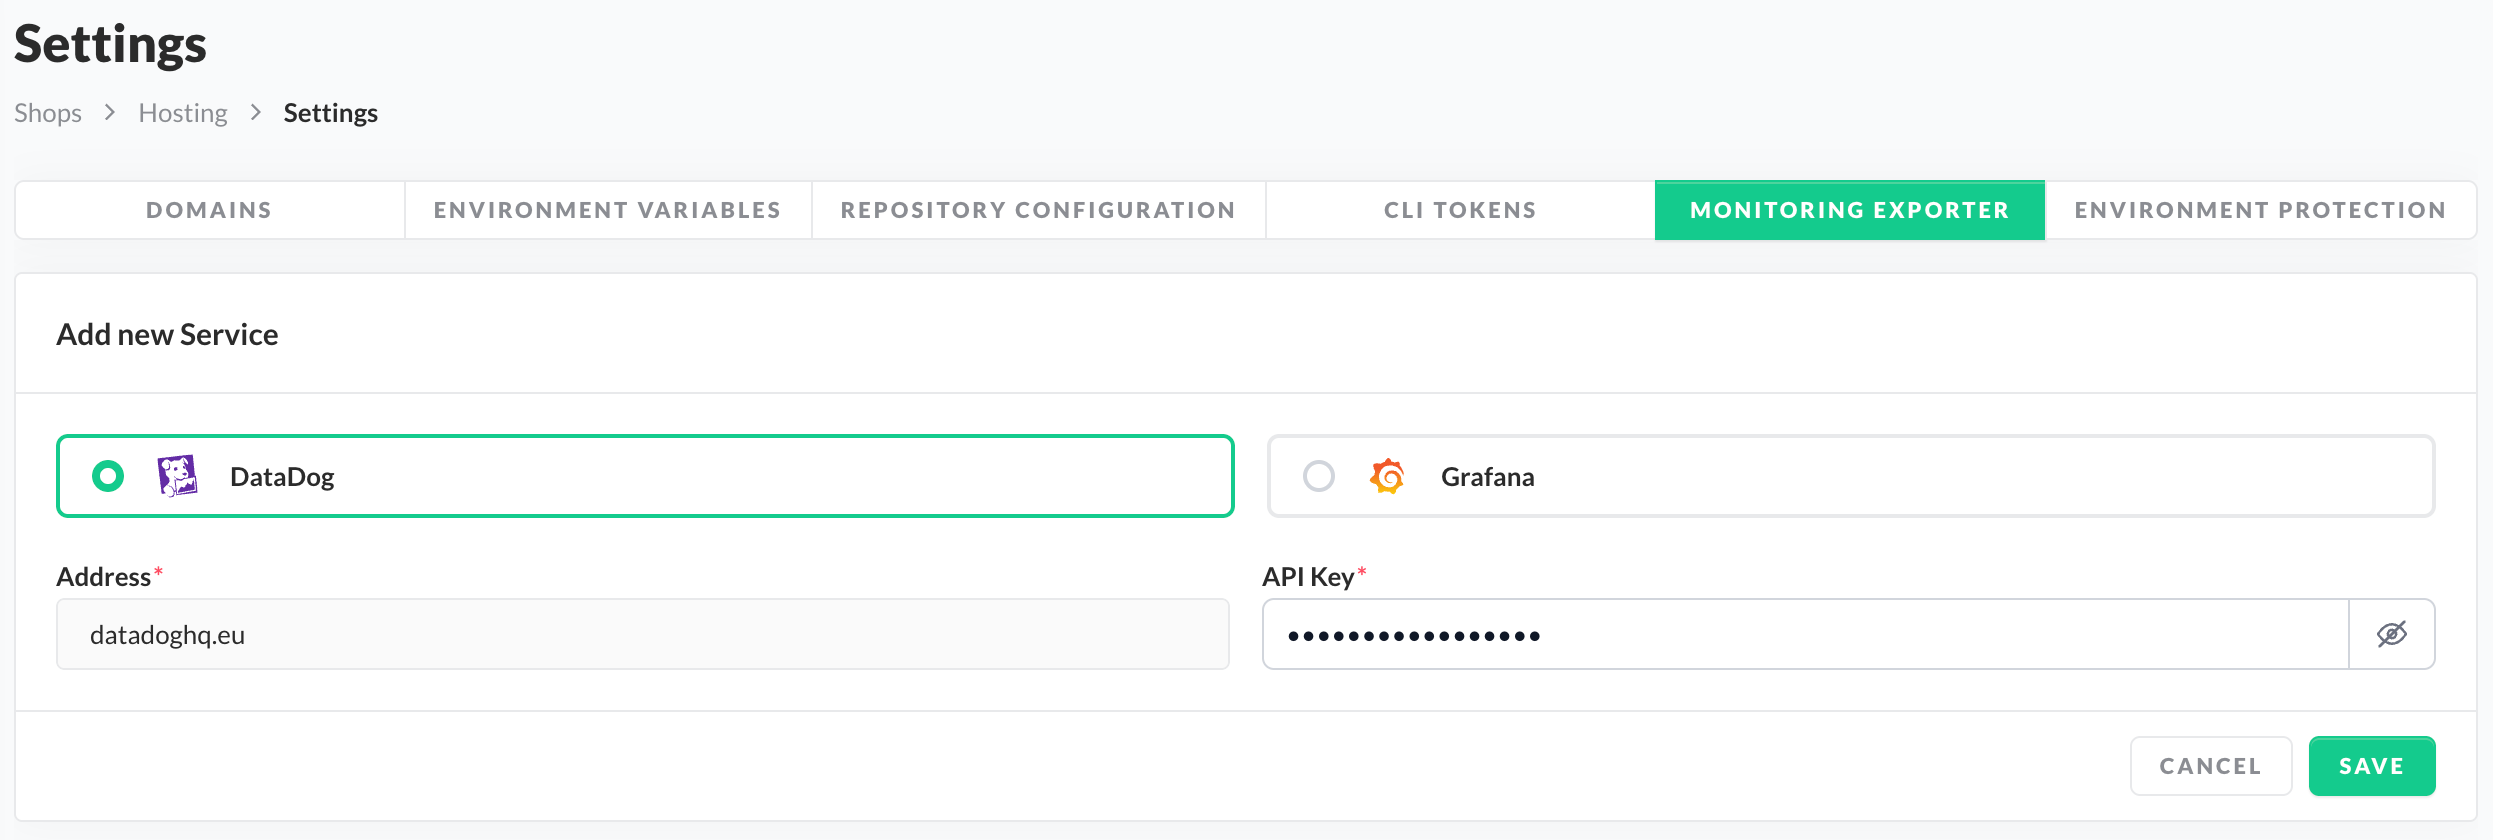
Datadog Exporter Setup
After successfully connecting to Datadog, we will start sending all collected monitoring data, like traces, metrics and logs, to your Datadog instance.
Please note that data collection only begins after you set up the Datadog exporter. Historical data from before the setup is not available.
To find your data, you need to search for the default "Service Name" of your Storefront Application, which is storefront.
Datadog Logs
Application Performance Monitoring
Application Performance Monitoring (APM) provides you with visibility into your Storefront application, enabling you to easily identify performance bottlenecks, troubleshoot issues, and monitor its health.
All performance metrics and traces for your Storefront application are shown within Datadog's APM section.
Here's how to find it:
- Navigate to the main menu on the left side of the screen.
- Hover over "APM", then select "Services".
- In the Services list, search for the default "Service Name" of your Storefront Application:
storefront. - Clicking the "Service Page" button will take you to the main APM dashboard for your application.
Make sure to filter the view for your environment. Use the filter bar "env" to select your specific environment, such as staging or production.
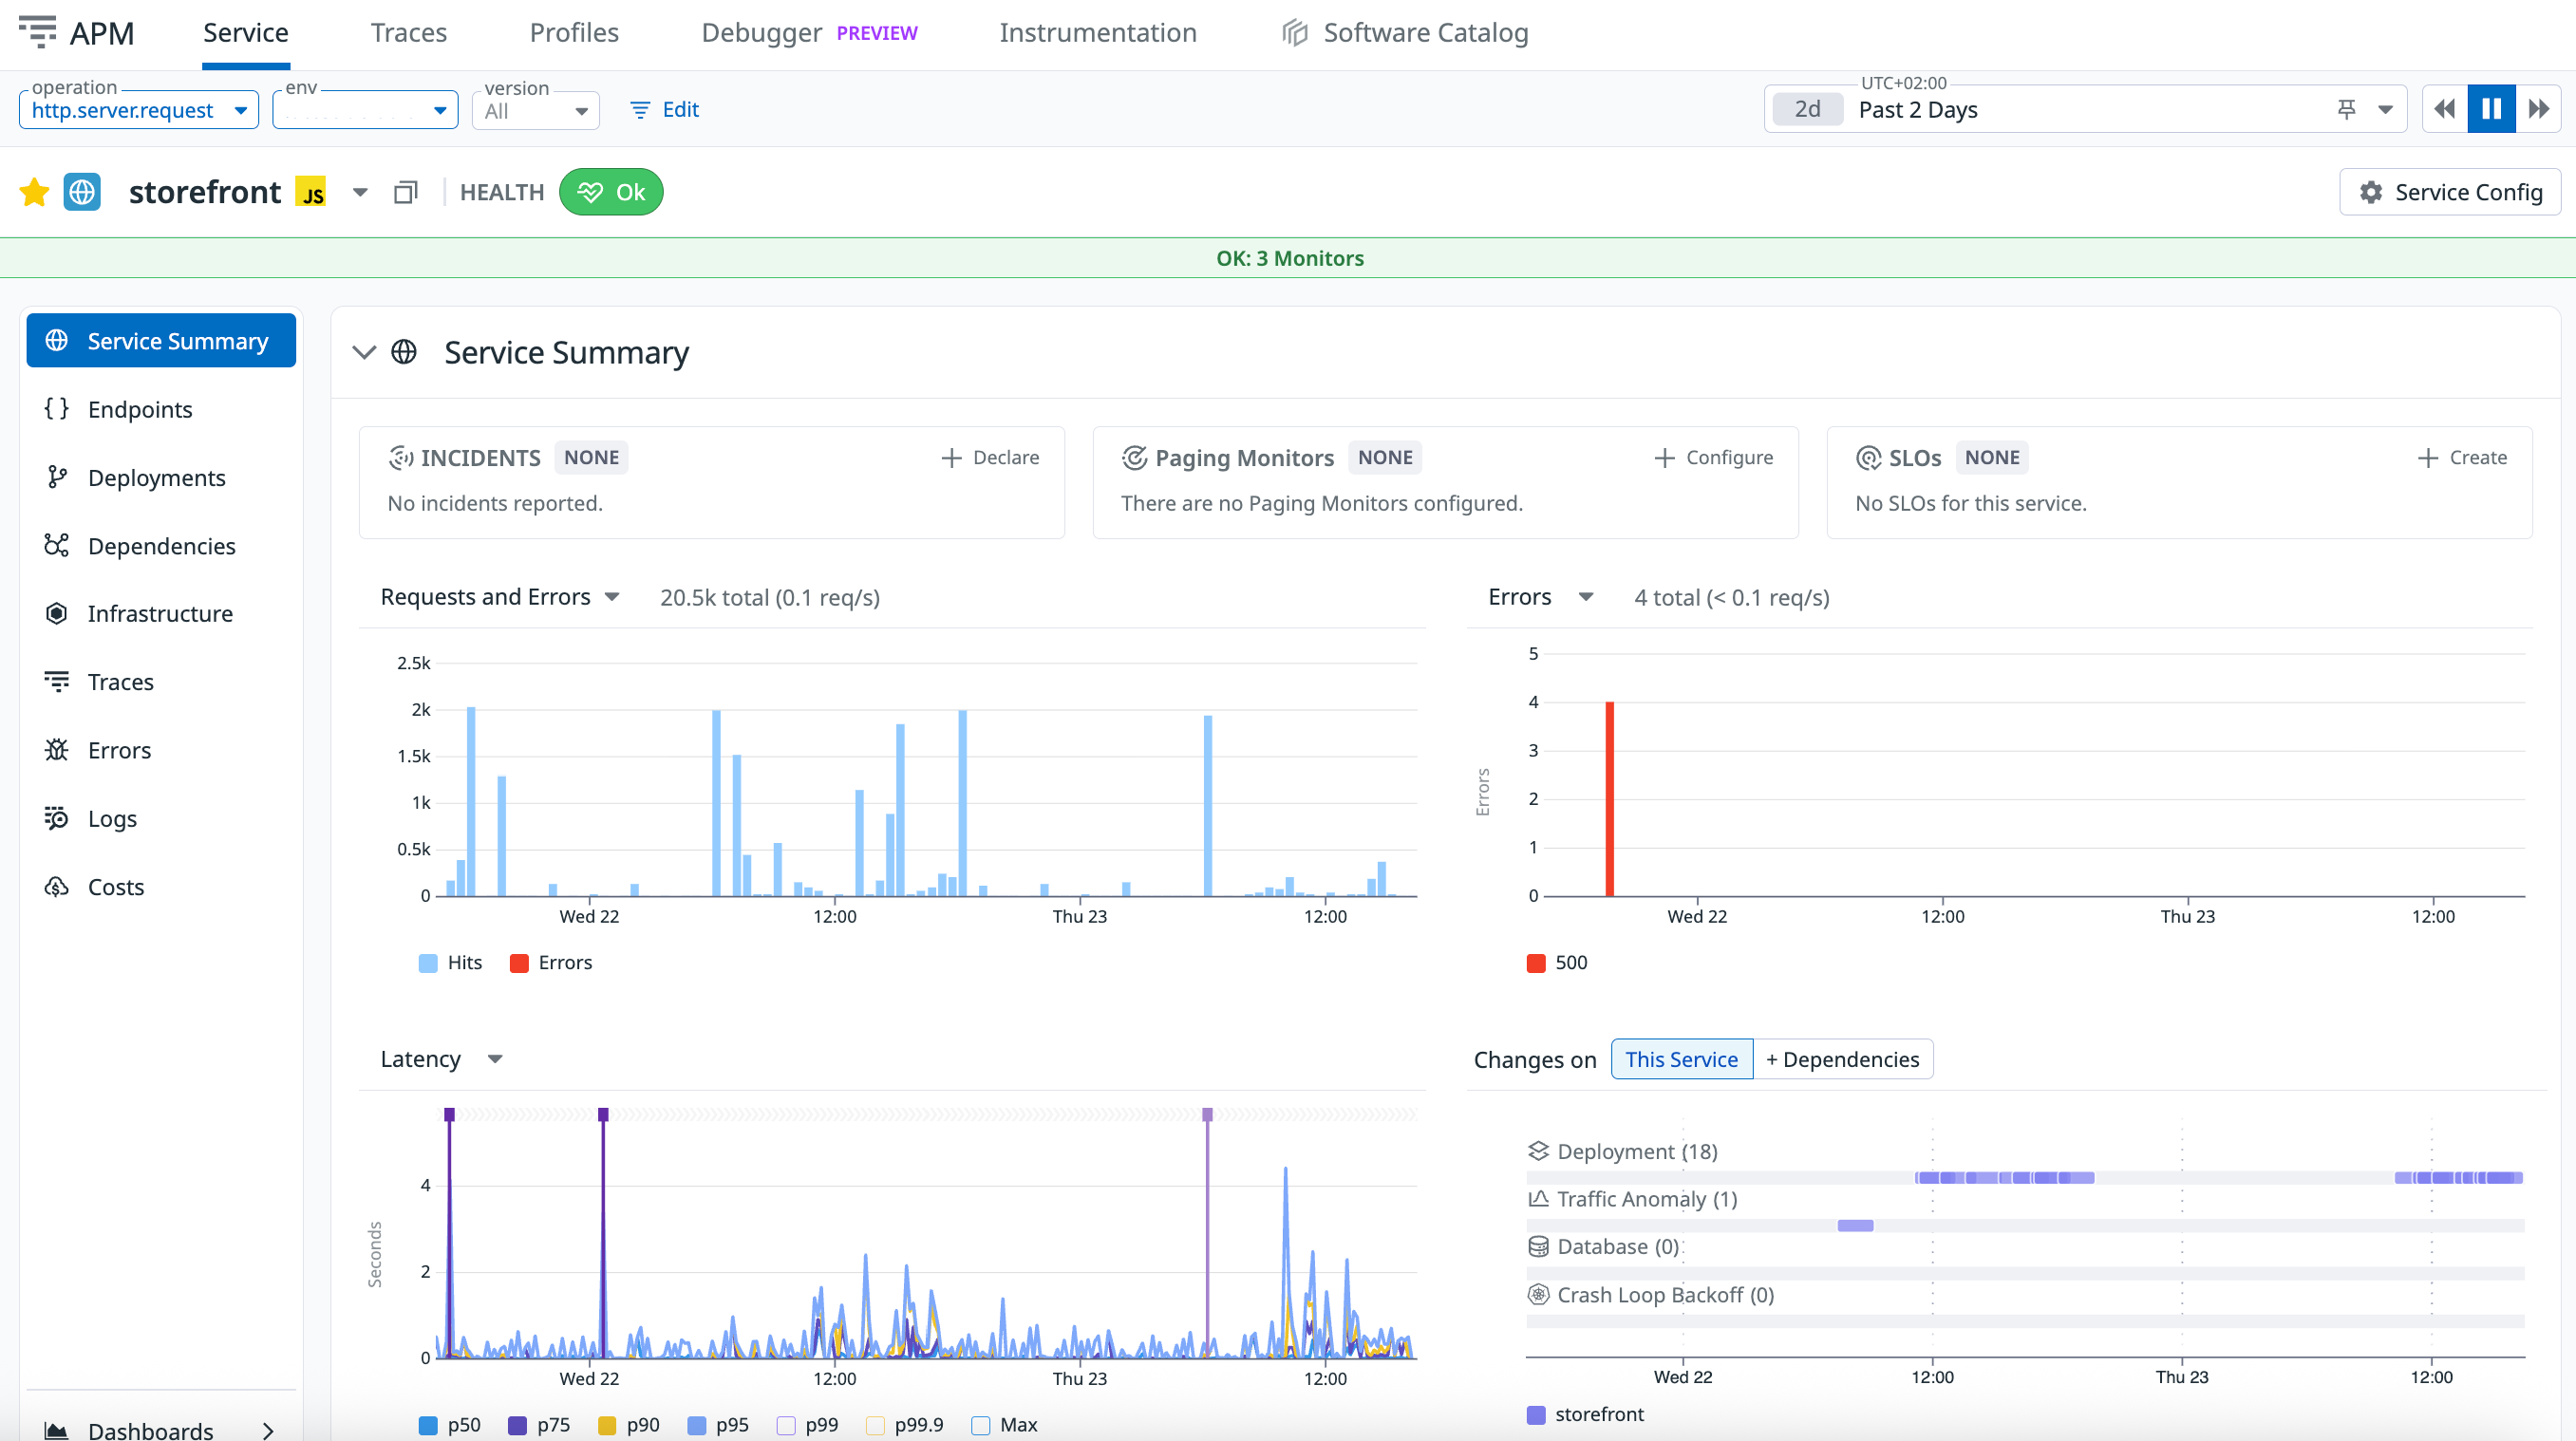
APM of Storefront Application
The APM dashboard provides you with instant visibility into the core health metrics of your Storefront application. You can easily view the many performance indicators for any selected time range, like:
- Throughput: Shows the number of requests and indicates how your application handles the load on the system.
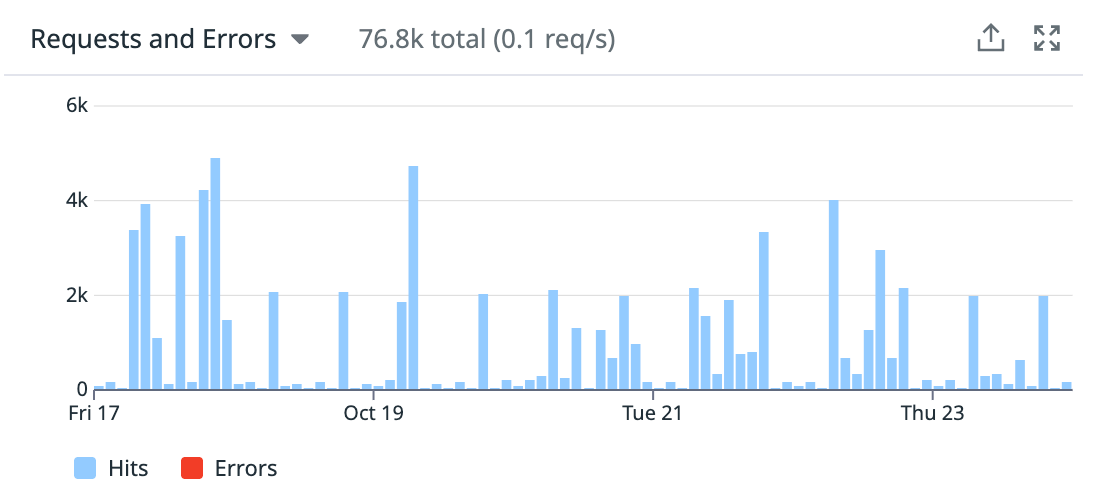
Throughput (Last 1 week)
- Errors: Shows the requests that result in errors and indicates potential application failures or certain instabilities.
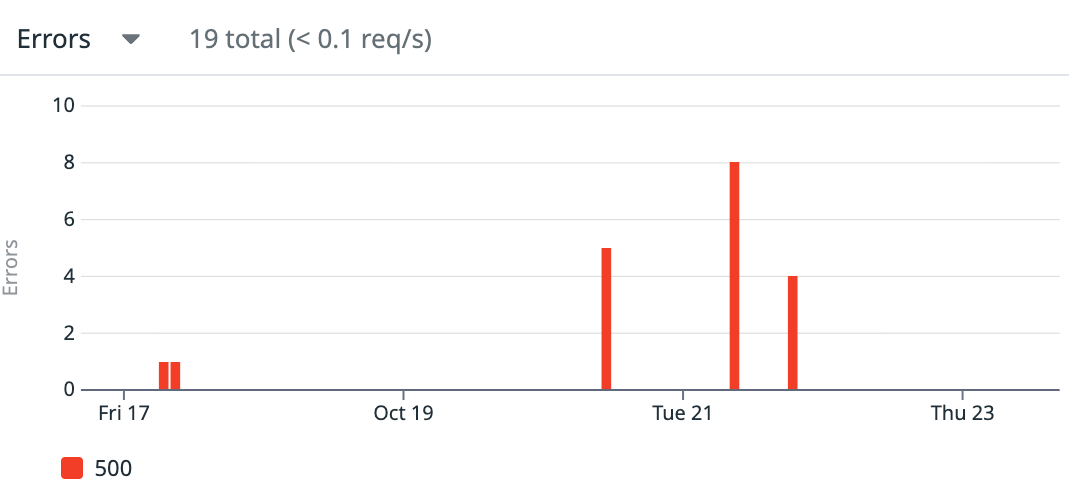
Errors (Last 1 week)
- Latency: Shows the time it takes for the request to complete and indicates potential performance bottlenecks.
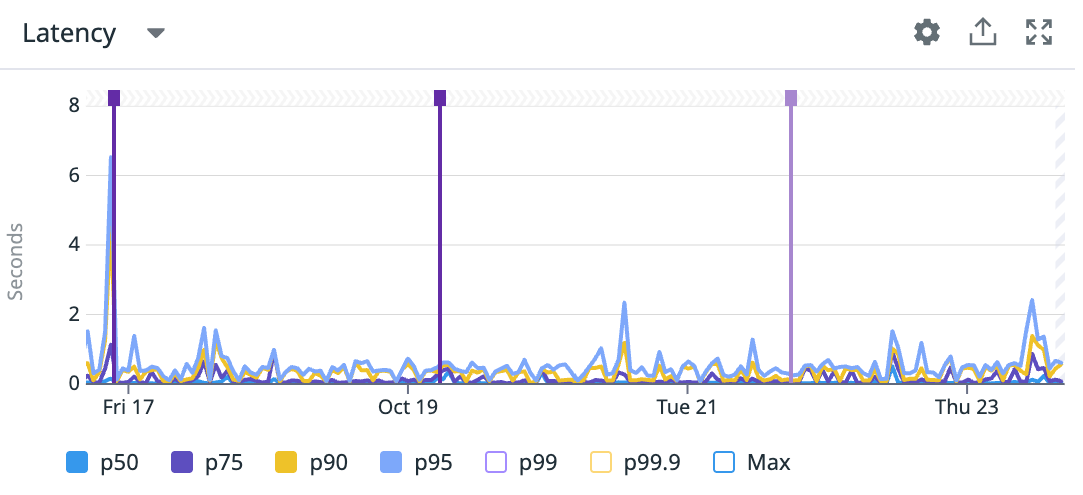
Latency (Last 1 week)
After examining the performance indicators and identifying that something might look suspicious, you want to have the possibility to trace the potential problem back to the source and evaluate its importance. To effectively troubleshoot, use:
- Errors tab of the
storefrontservice page to see aggregated error data, allowing you to identify what is responsible for a spike in errors.
APM Errors
Clicking on an error opens a detailed view, providing insights into its frequency and timing. You'll also find a complete stack trace to help you rapidly debug the problem.
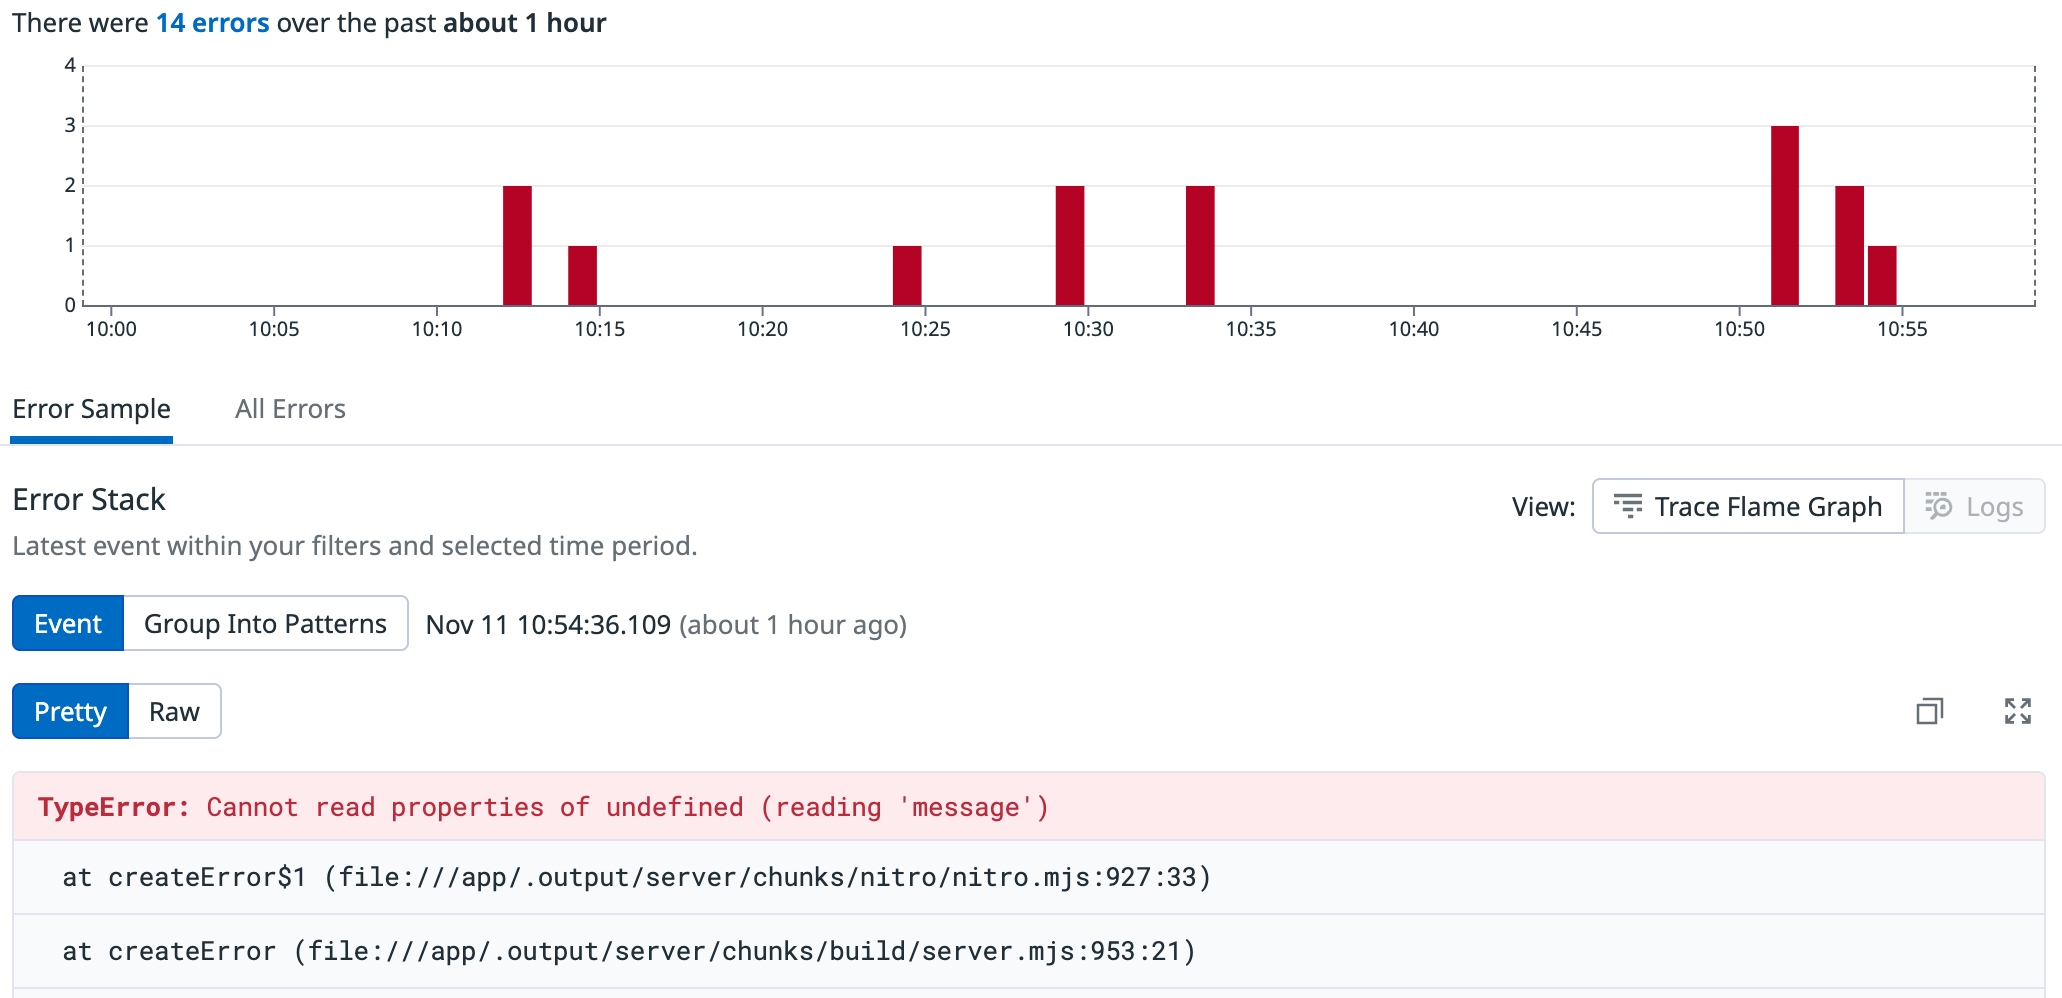
Error Detailed View
- Traces tab of the
storefrontservice page to see specific requests, allowing you to examine suspicious or slow requests.
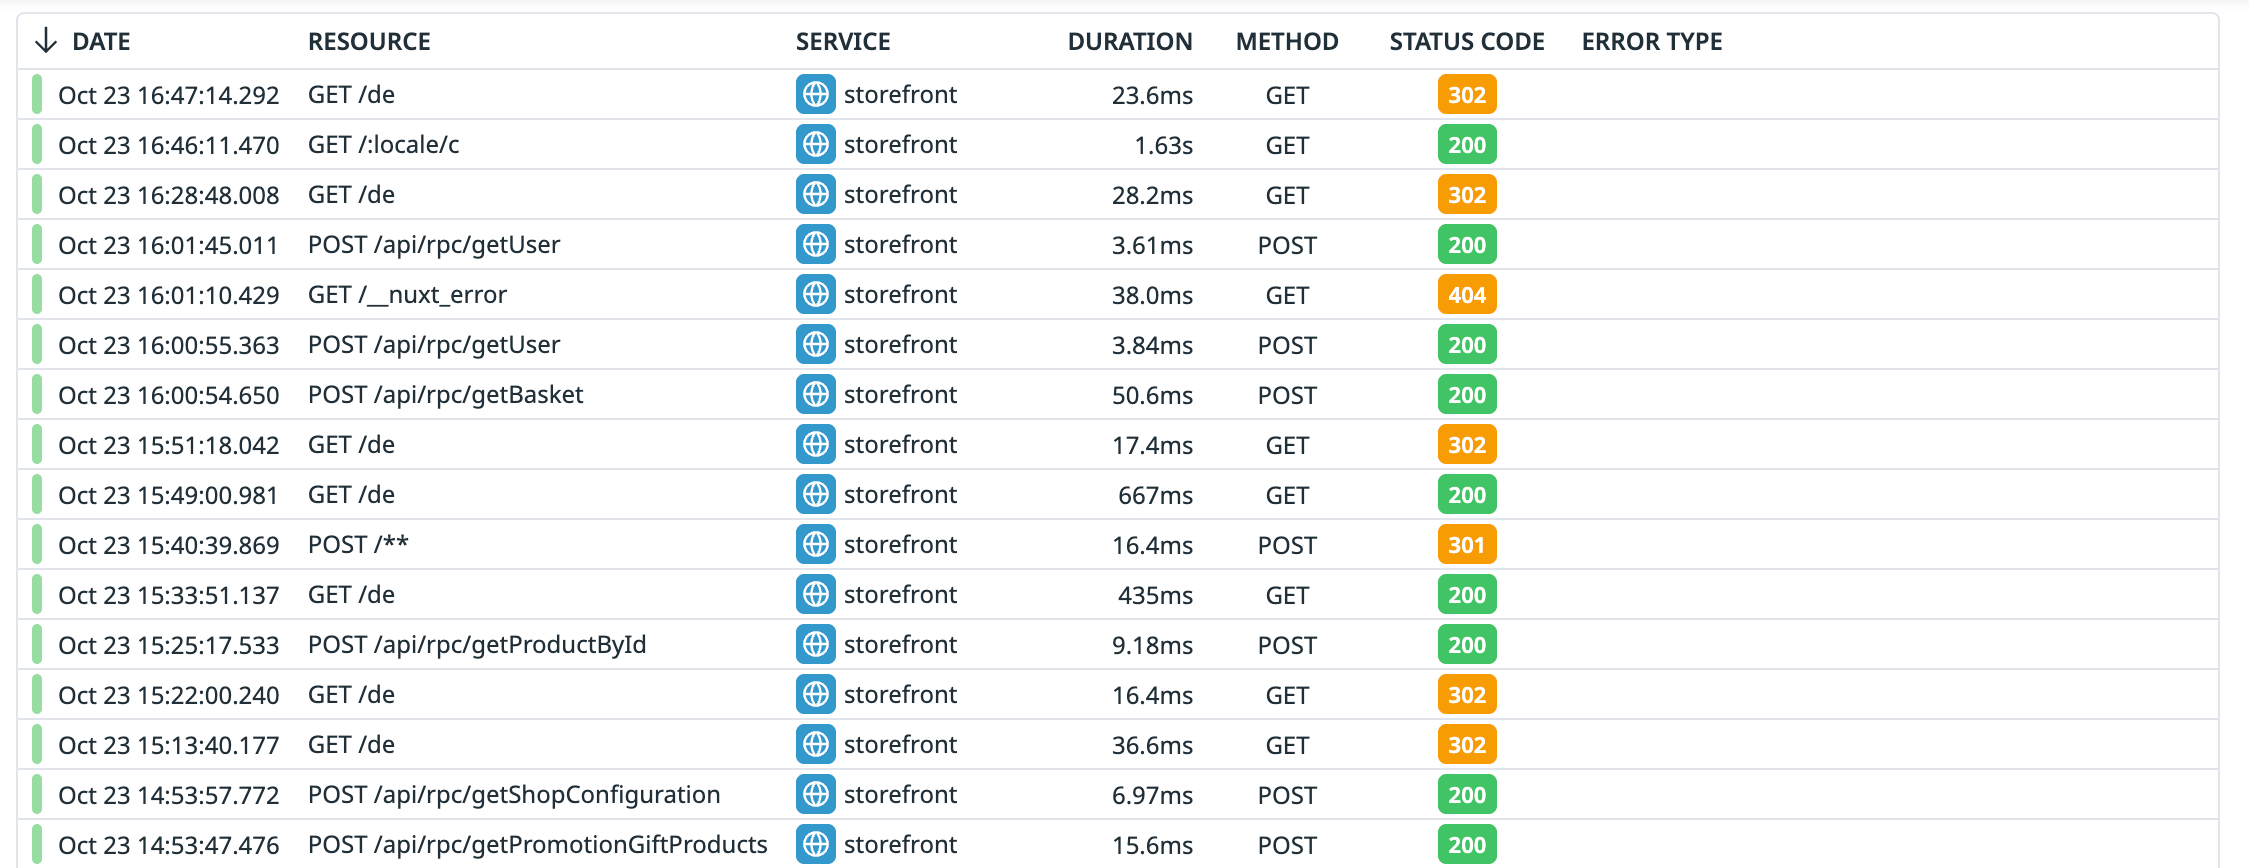
Subset of Traces in APM
Clicking one of the traces provides detailed insight into the request flow and lets you identify potential issues quickly.
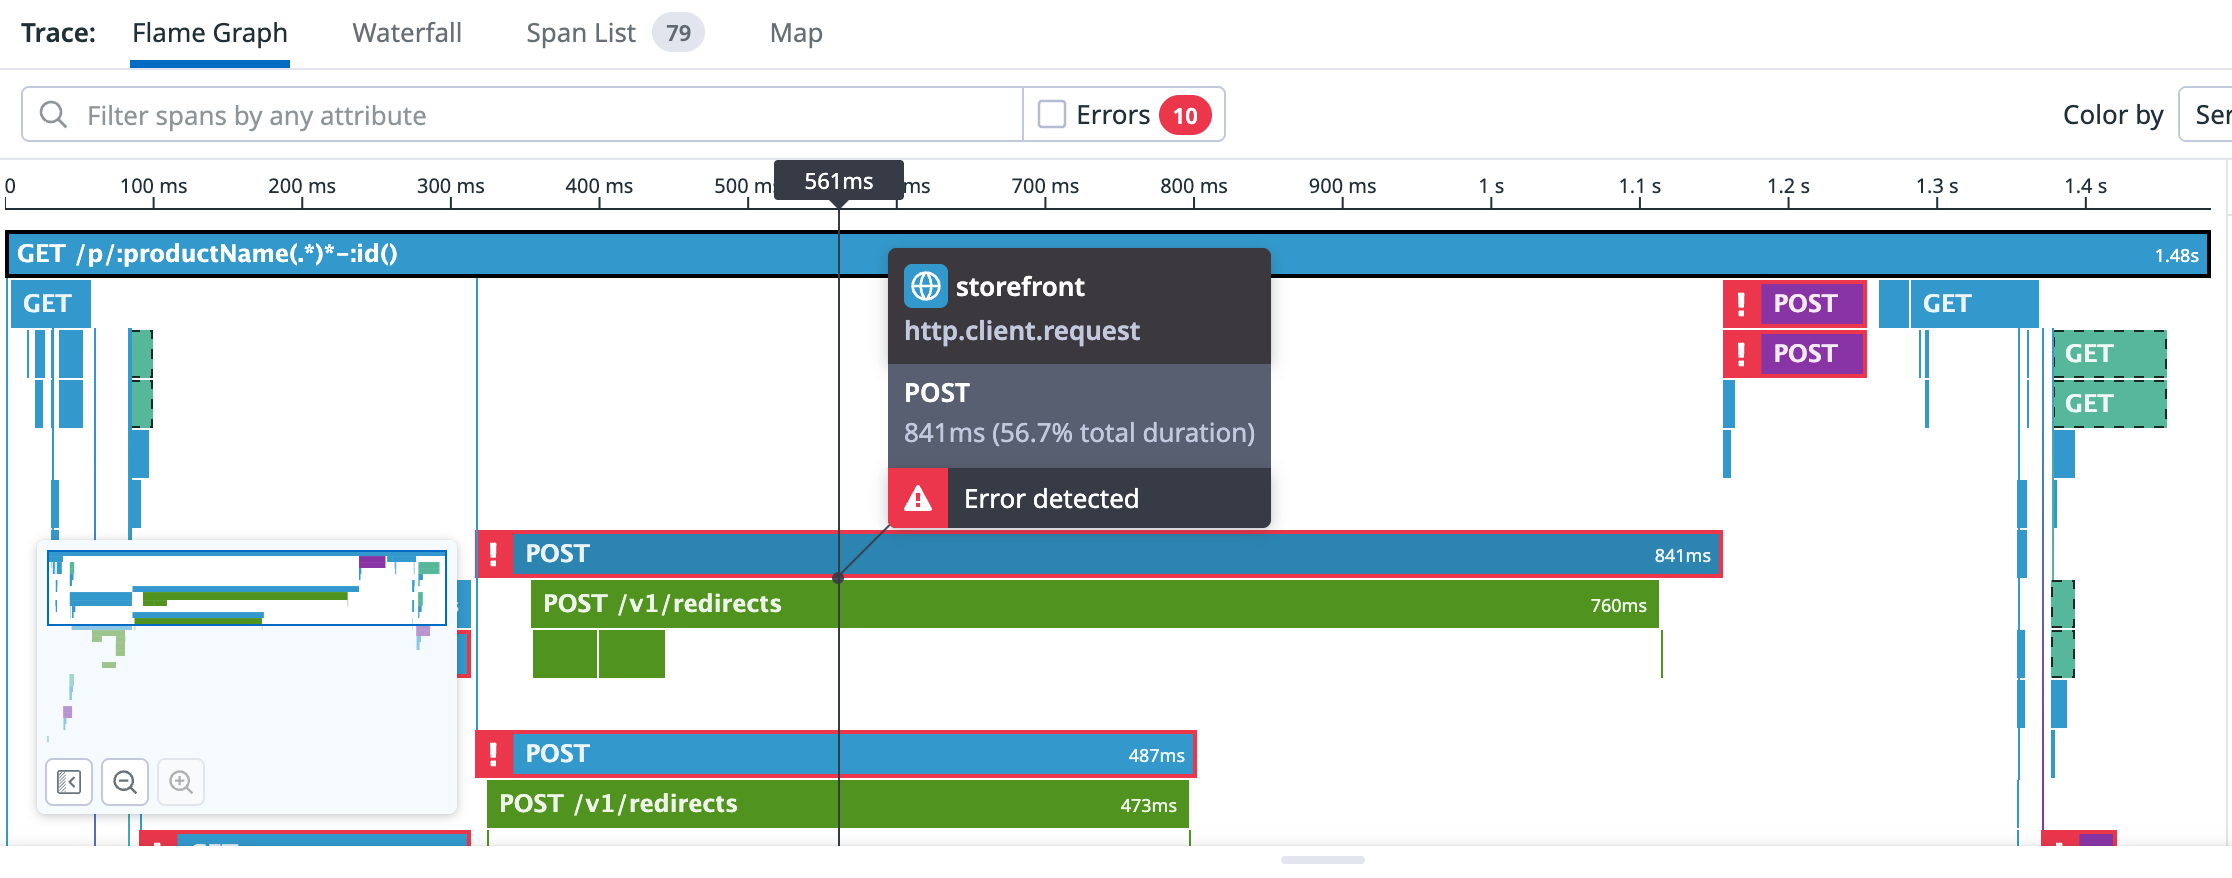
Traces Detailed View
- Logs tab of the
storefrontservice page to see aggregates of messages that are produced by your deployment. This is the fastest way to spot recurring log patterns that might indicate a problem.
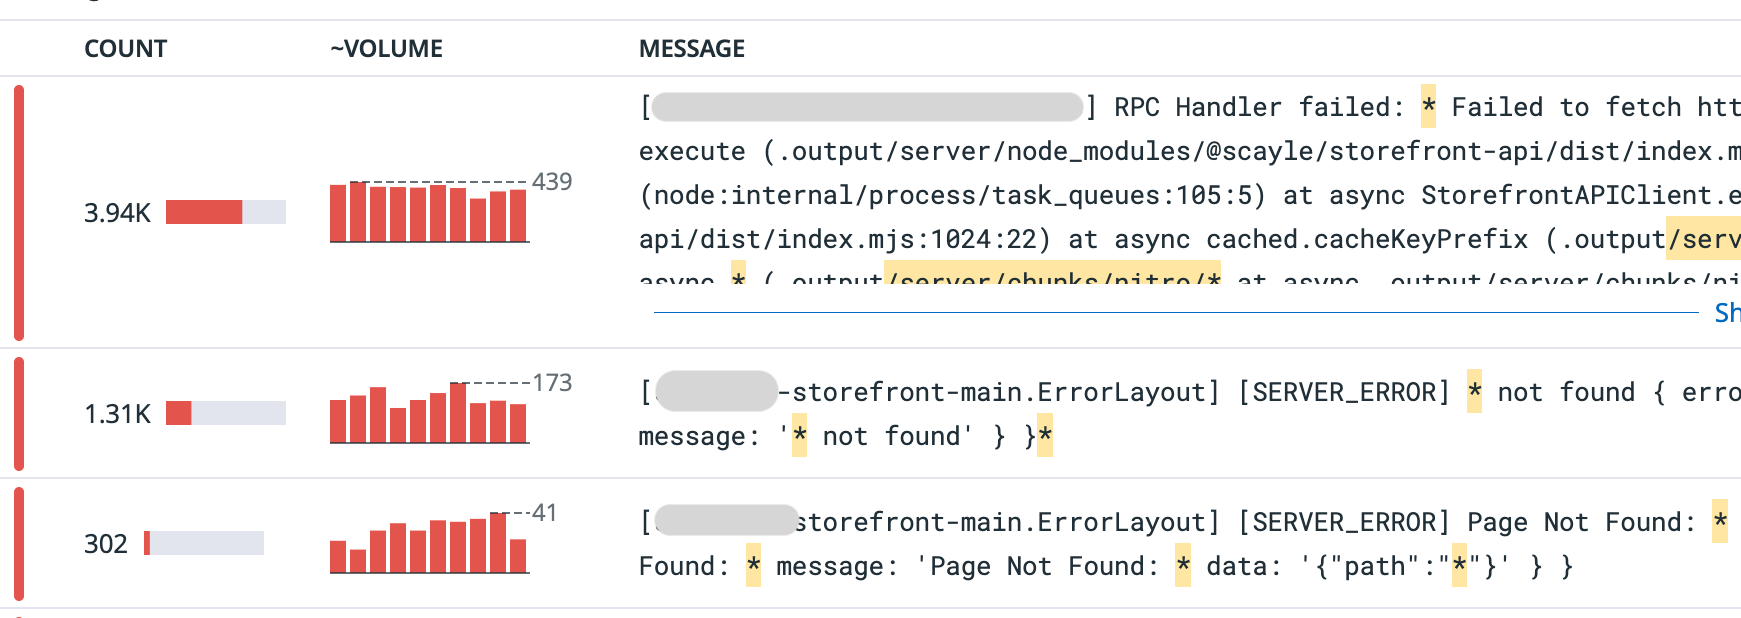
Logs
While APM shows you the full journey of a request and pinpoints where it failed (like a stack trace or failing span), Logs provide the detailed, text-based context around that failure (the exact error message, file name, or request payload).
Here's how to find the logs of your Storefront Application:
- Navigate to the main menu on the left side of the screen.
- Click on "Logs", then select "Explorer".
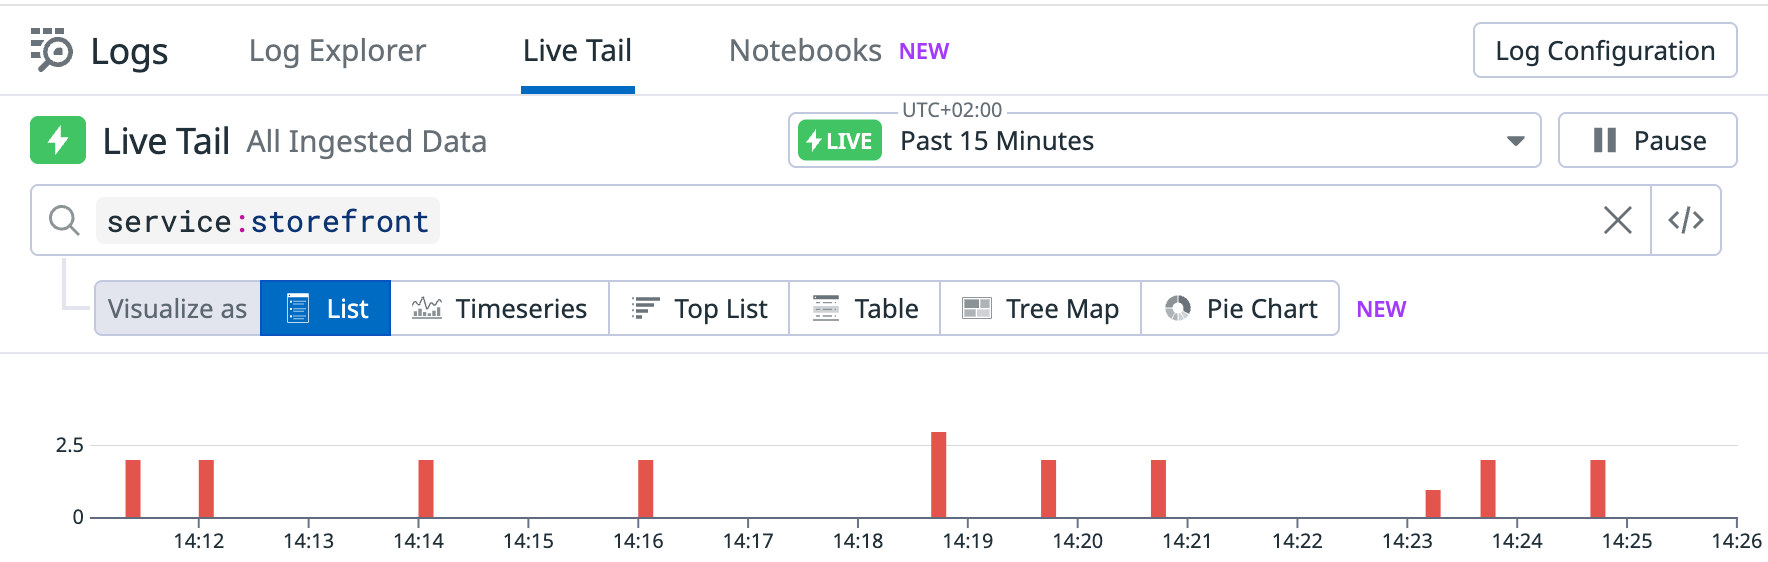
- Use the search query to filter for
service:storefrontand optionally for the environment (e.g.@scayle.platform.tenant_space:{tenantSpace}) to ensure you view only the log activity generated by your hosted application for a specific environment.
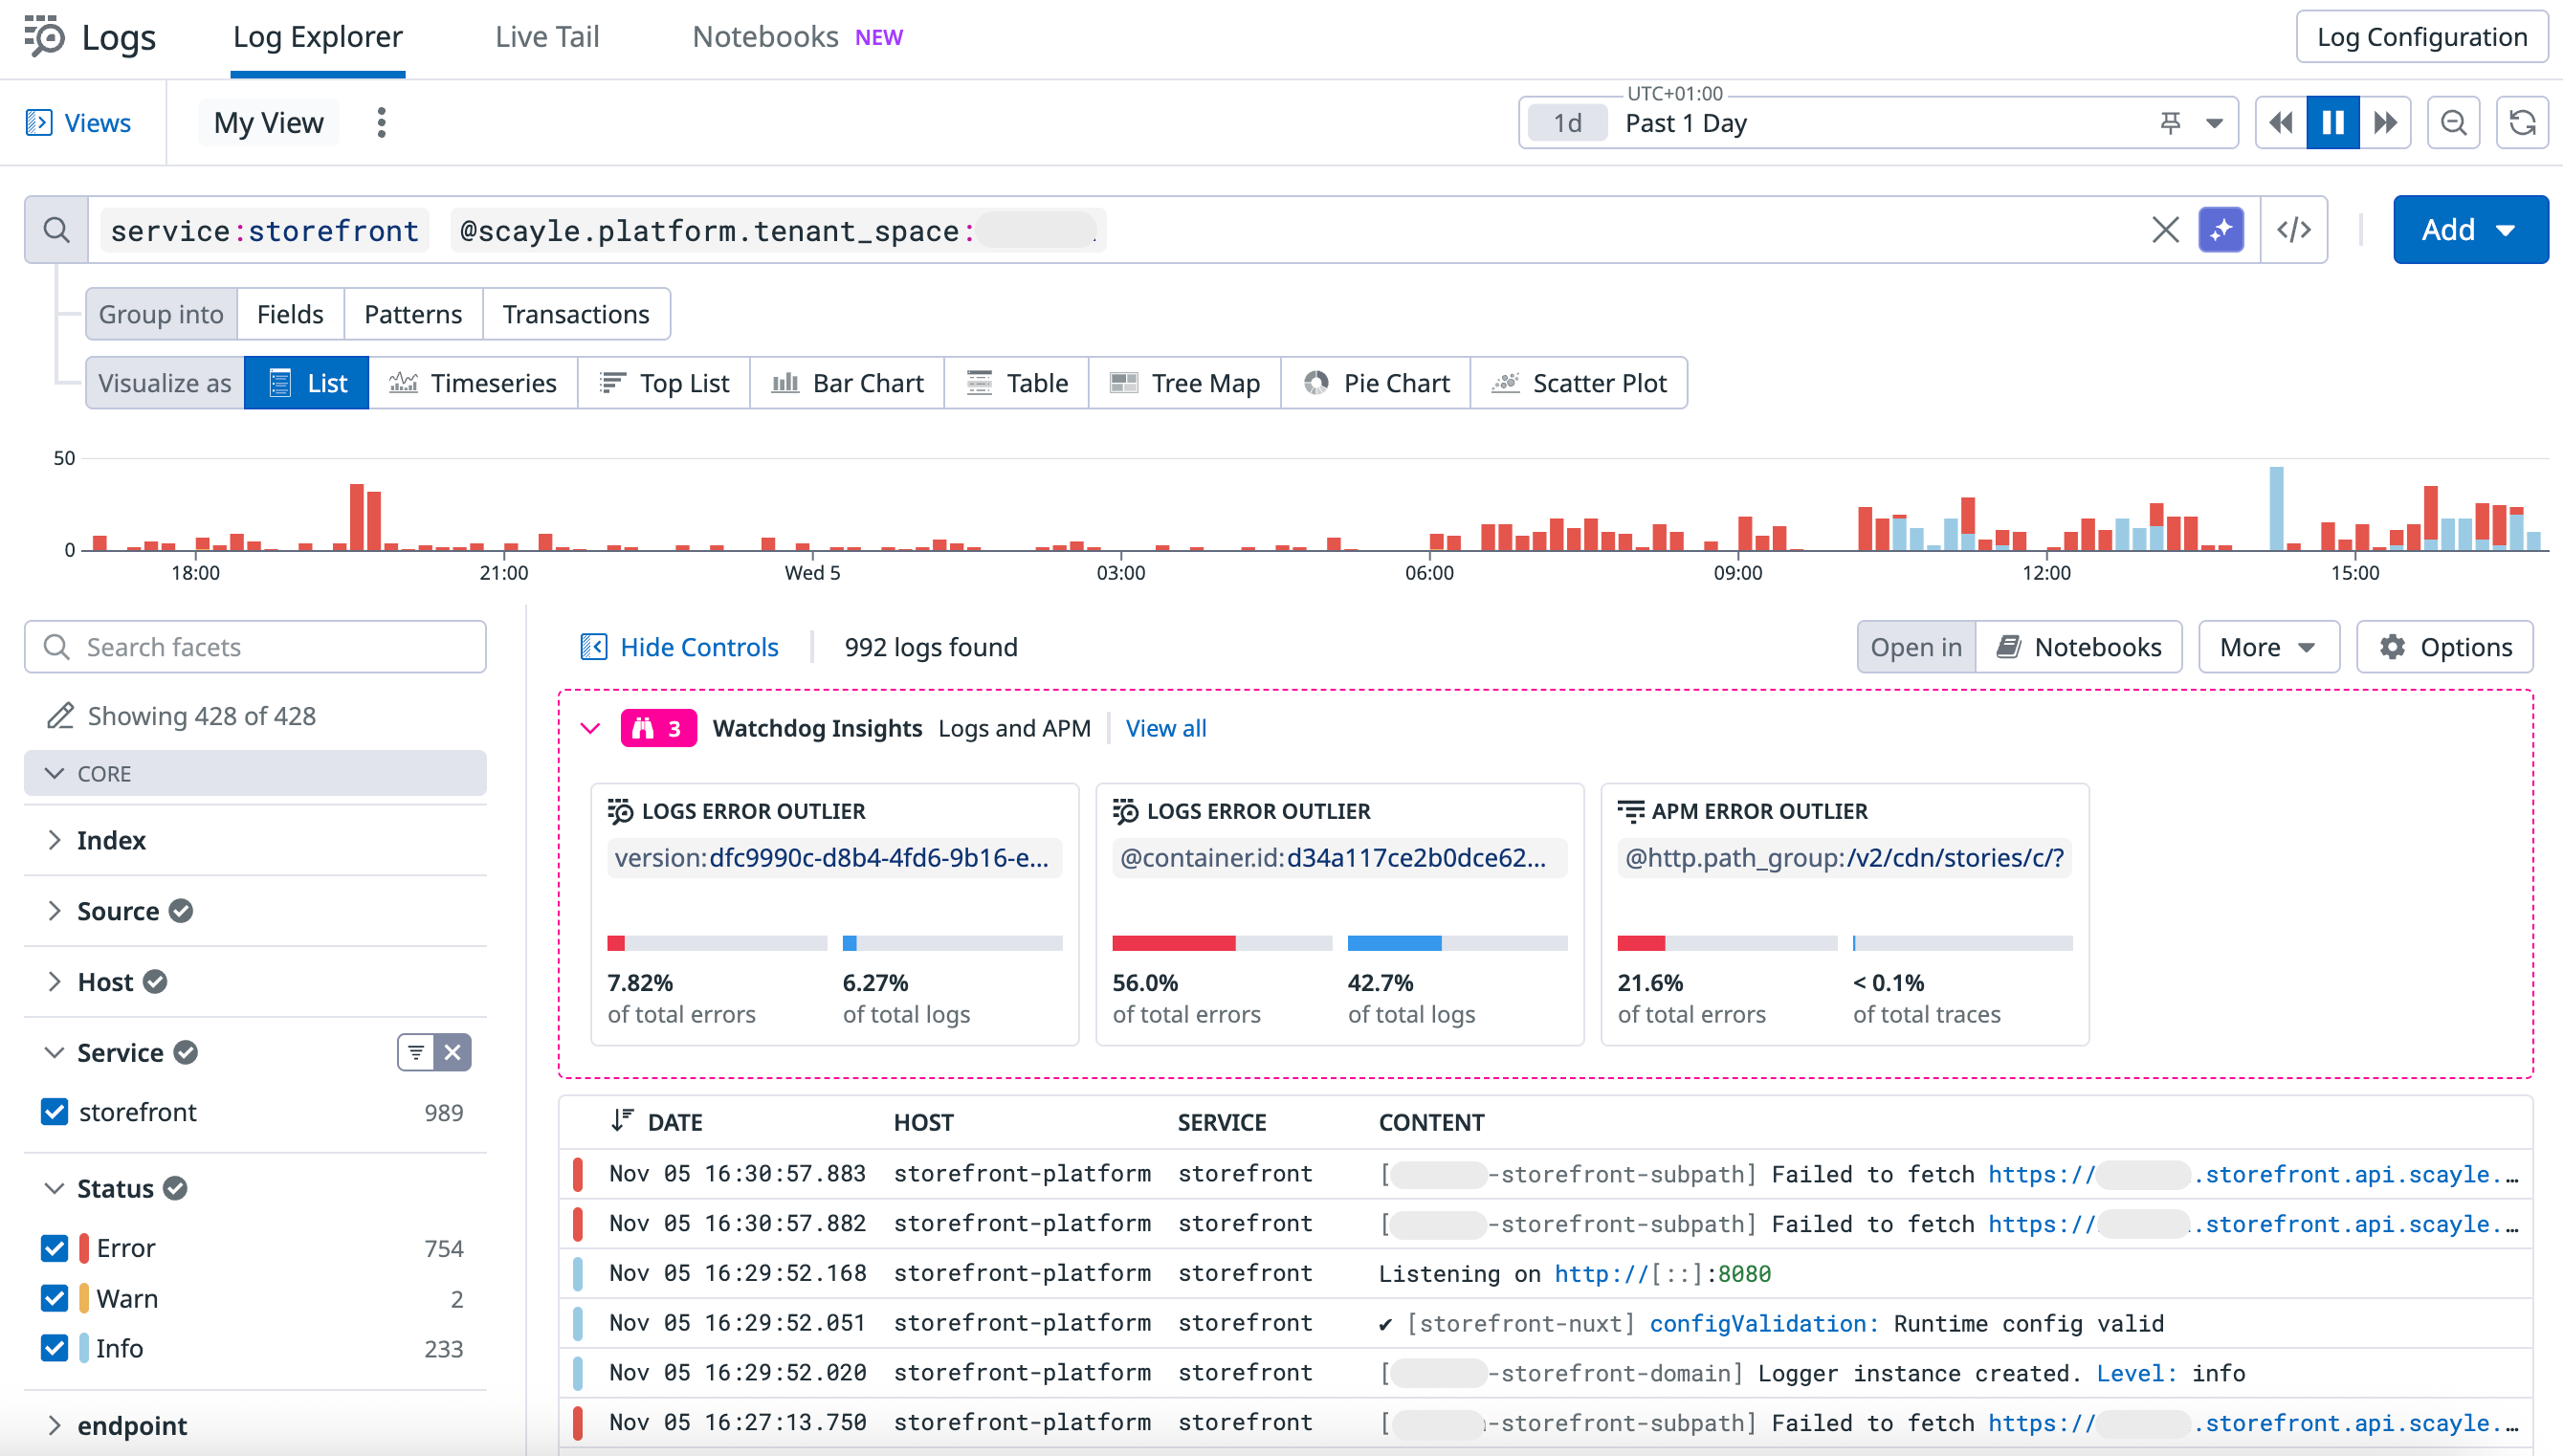
Logs Section
Here you can see all log messages filtered by the applied filters and within the selected timeframe. When clicking on one of the log lines, you will be presented with a detailed view of the log and all the attached attributes.

Detailed View of a Specific Log
We automatically enrich every Storefront log with standardized metadata, so you can easily filter and find the exact messages you need to troubleshoot.
Here's also an extract of the data attached to the log, with a detailed explanation of what they present:
scayle.platform.build.id: The ID for the build of the application code that was running.scayle.platform.deployment.id: The ID for this specific application deployment at a given time.scayle.platform.env.key: The deployment environment where the application was running.scayle.platform.shop.key: The key for a specific shop within the SCAYLE system.scayle.platform.tenant_space: The tenant instance within our platform.
You can directly filter for relevant fields from within the detail view of the log entry by hovering over the respective field and using the provided context menu.
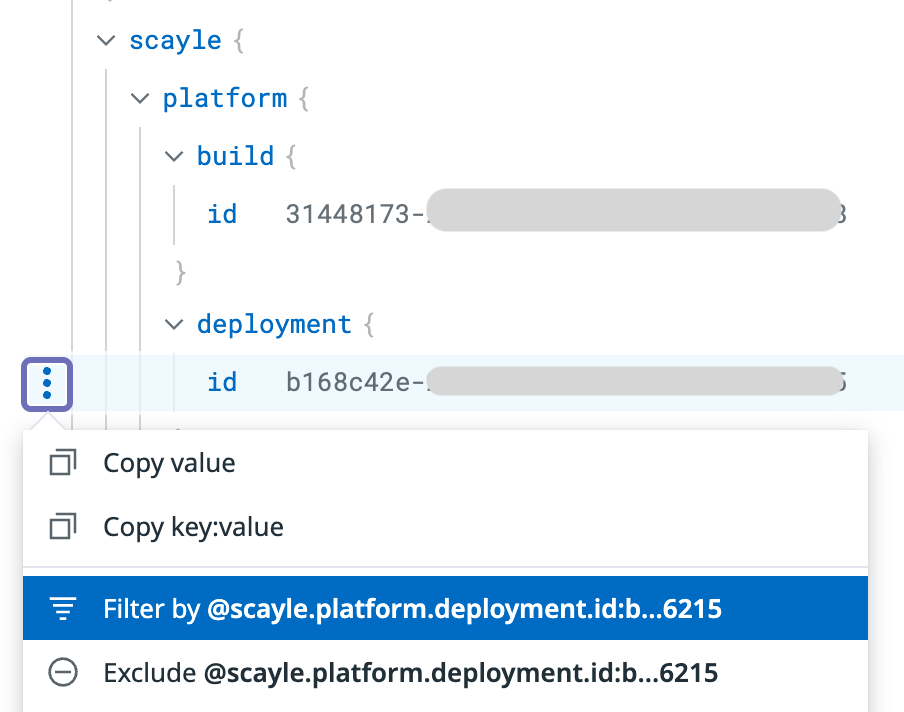
Filter within the Log
Alerting
Alerting is especially important for your application stability. It notifies you when critical performance metrics or error rates reach unacceptable thresholds, allowing you to react immediately and protect your Storefront application, thereby reducing business impact.
Here's how to create a monitor in Datadog for your Storefront application:
- Navigate to the main menu on the left side of the screen.
- Click on "Monitors", then select "Explorer".
- You can choose the monitoring types you want for your Storefront Application from here.
As an example, let's create a dedicated standard alert for "High Error Rate", which notifies you if the underlying API of your Storefront starts failing regularly, as maybe a sign of a deployment issue or a failure.
- Select "APM" as the monitor type with the configuration for Steps 1 & 2 as defined below:
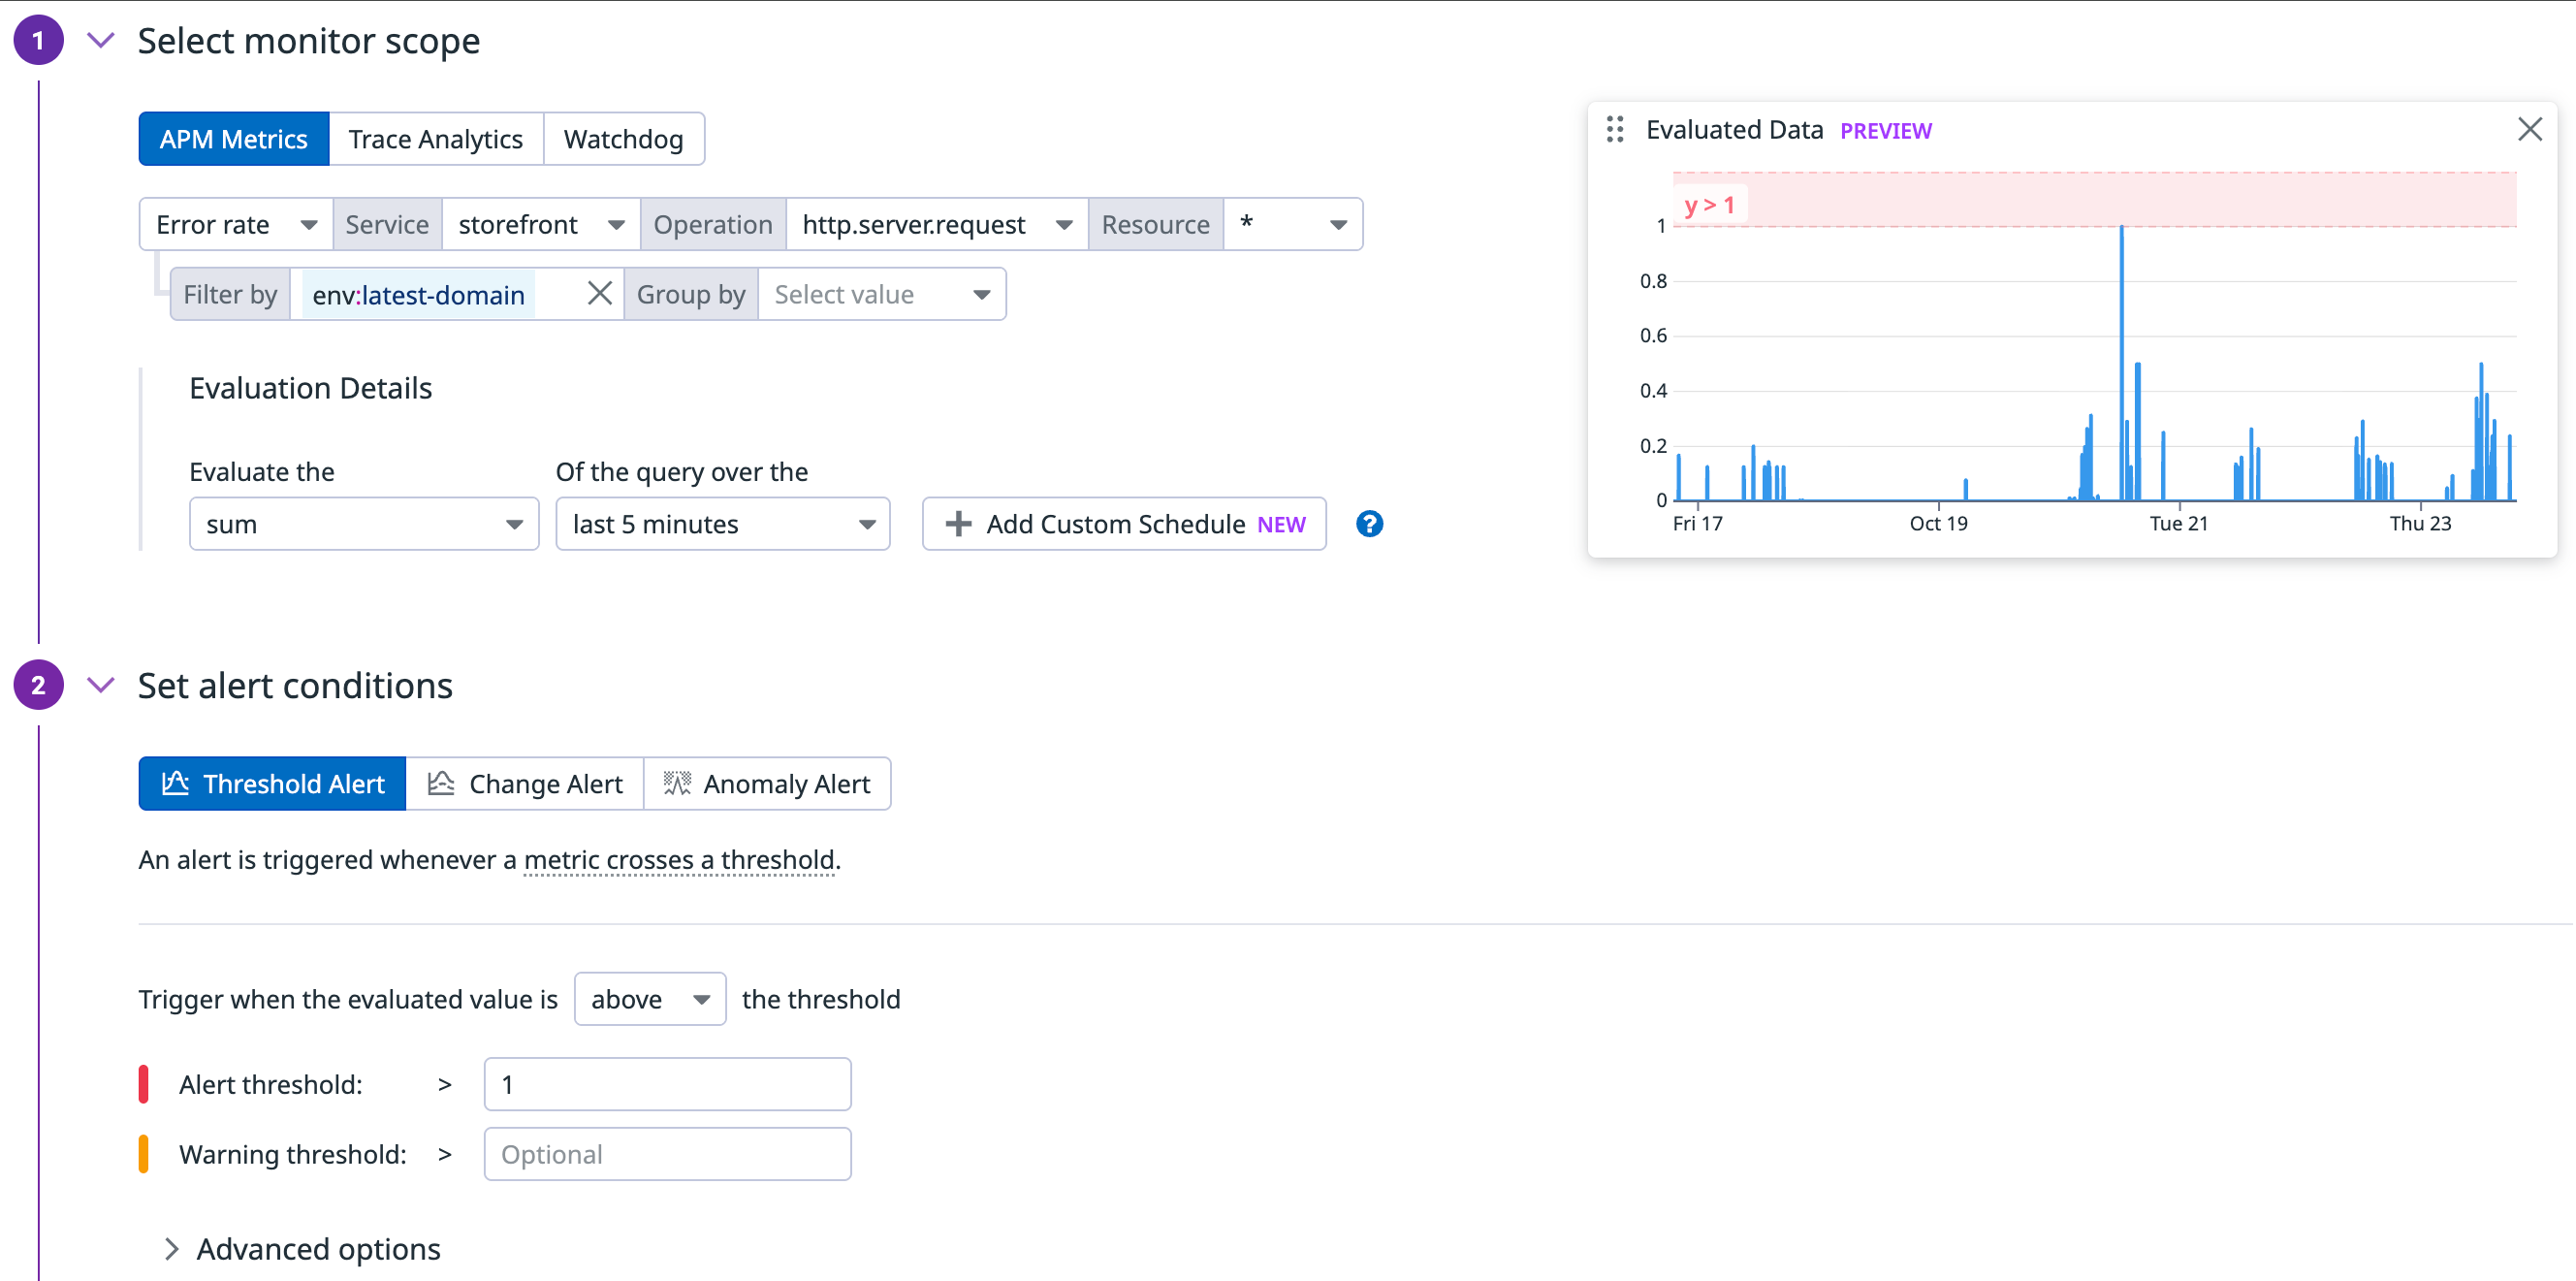
Alert Setup

