Insights
Overview
The Insights section provides near real-time visibility into the performance and stability of your Storefront Application. It offers a quick outlook into how your users are experiencing the application without any additional manual setup. By collecting metrics at the infrastructure level, we provide an objective view of your Storefront's performance.
Key Metrics
The Insights section offers a comprehensive view of Storefront performance, encompassing three key metrics: throughput, errors, and response times.
These results are refined by adjusting the selected view settings:
- Timeframe Dropdown: Displays the available time frame for listing metrics (in addition to the default
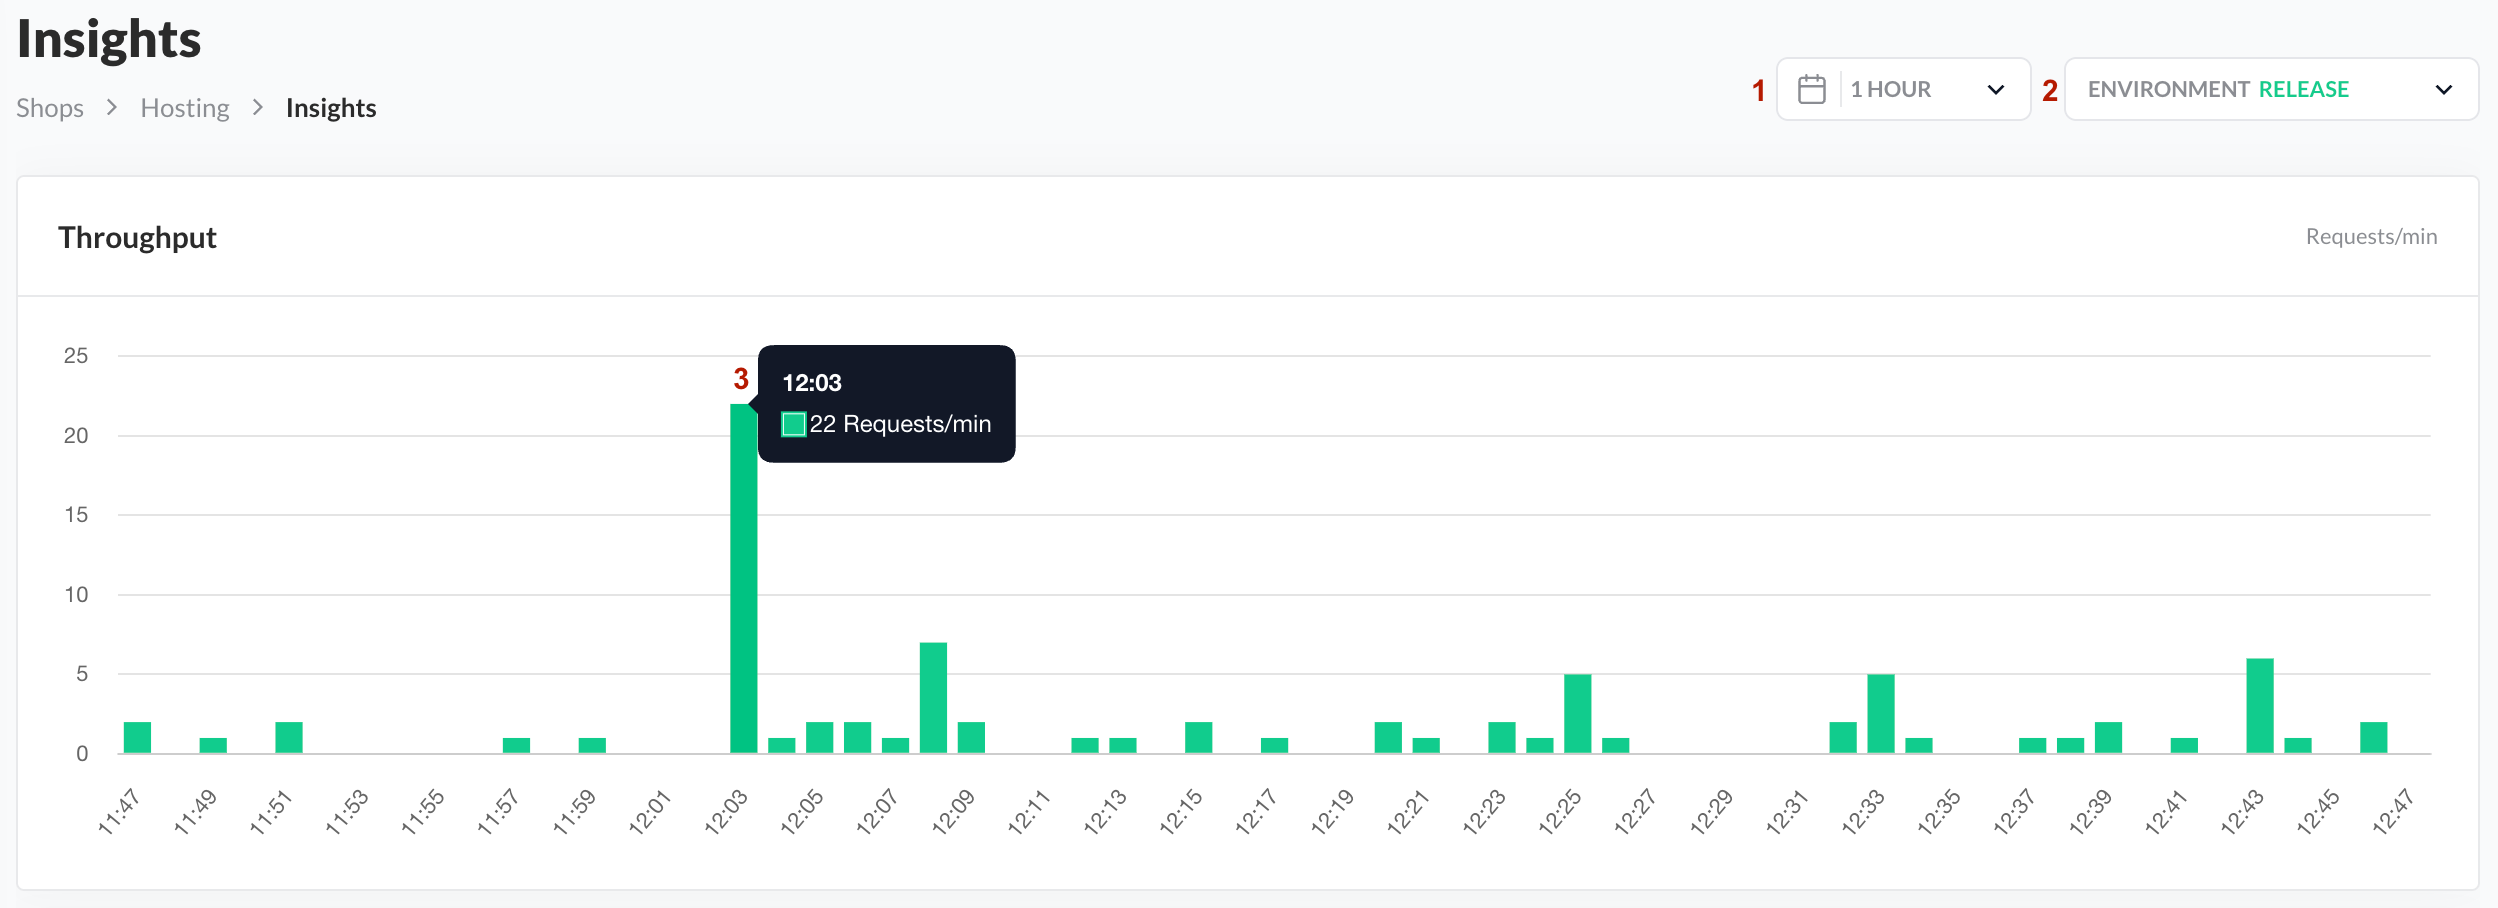
1 hourview, timeframe options include1 day,3 days,1 week, and1 month). Selecting a different timeframe triggers an immediate update of all page data. - Environments Dropdown: Provides an overview of available environments and offers the creation of additional ones. Selecting a different environment triggers an immediate update of all page data.
Moreover, by hovering over the selected bars, you can examine the exact metric value (3).
Throughput
- Represents the total volume of traffic and requests processed by the Storefront Application on a selected environment.
- This metric reflects the number of requests the Storefront receives within a given period, providing a general overview of customer traffic.

Throughput
Errors
- Provide a categorized summary of Storefront Application stability based on HTTP status codes.
- By grouping issues into 4xx (Client Errors) and 5xx (Server Errors), the graph highlights potential blockers, patterns and stability trends without the need to manually analyze logs.

Errors
Response Time
- Measures the duration of user requests in milliseconds.
- Data can be checked across 50th, 90th and 99th percentiles to distinguish between typical performance and the experience of the slowest 1% of users.

Response Time