

Dynatrace
Overview
Dynatrace is an AI-powered observability platform that provides full-stack monitoring across applications, infrastructure, logs, and traces, with built-in AI for anomaly detection and root-cause analysis. To leverage this power, the Storefront Hosting platform makes it easy to export your monitoring data to Dynatrace, unlocking its full potential. This out-of-the-box integration instantly provides real-time visibility into your Storefront Application's performance and behaviour, ensuring you can proactively troubleshoot issues and maintain a high-performance shopping experience for your business.
To learn more about Dynatrace, visit their official documentation center.
Set Up
When adding the Dynatrace exporter, you need to fill in two fields:
- Instance ID: The ID of your Dynatrace environment. You can find it in the URL of your Dynatrace web UI - for example, in
https://abc12345.live.dynatrace.com/, the Instance ID isabc12345. - API Key: A Dynatrace API Token (also called an Access Token) with the scopes listed below. See Dynatrace's Tokens and authentication documentation for details on token creation.
Use a classic API Token, not a Platform Token. Dynatrace offers several token types. The SCAYLE exporter uses Dynatrace's OTLP ingest endpoints, which require a classic API Token (token IDs starting with dt0c01). Platform Tokens (dt0s16 prefix) and OAuth clients use different scope naming and will not work for this integration.
Required scopes
When creating the API Token in Dynatrace, look in the API v2 section of the scope picker and grant the following:
logs.ingest- for logs and the OpenTelemetry log ingest APImetrics.ingest- for metrics and the OpenTelemetry metrics ingest APIopenTelemetryTrace.ingest- for OpenTelemetry traces
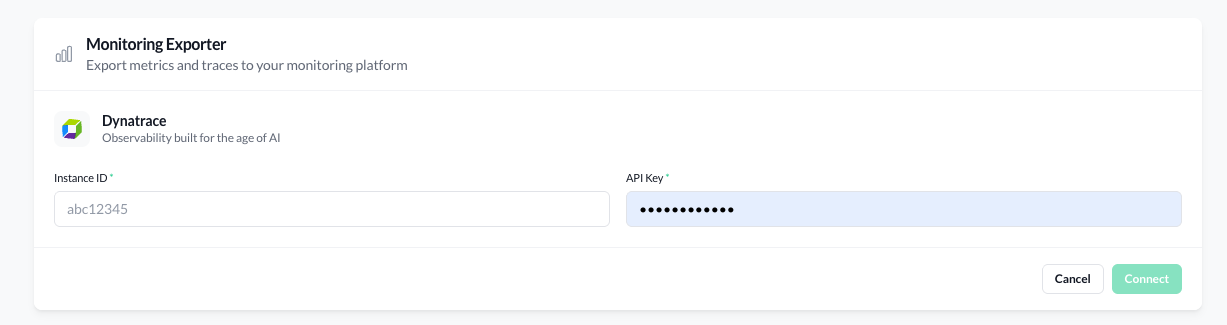
After successfully connecting to Dynatrace, SCAYLE will start sending all collected monitoring data - logs, metrics, and traces - to your Dynatrace environment.
To find your data, search for the default "Service Name" of your Storefront Application, which is storefront.
Finding your data in Dynatrace
Once the integration is live and your storefront has traffic, your telemetry data appears in Dynatrace under the service named storefront (or whatever Service Name you configured in SCAYLE's Telemetry Settings).
The fastest way to find your data is through the Notebooks app using DQL (Dynatrace Query Language), but each data type also has its own dedicated app for browsing and filtering.
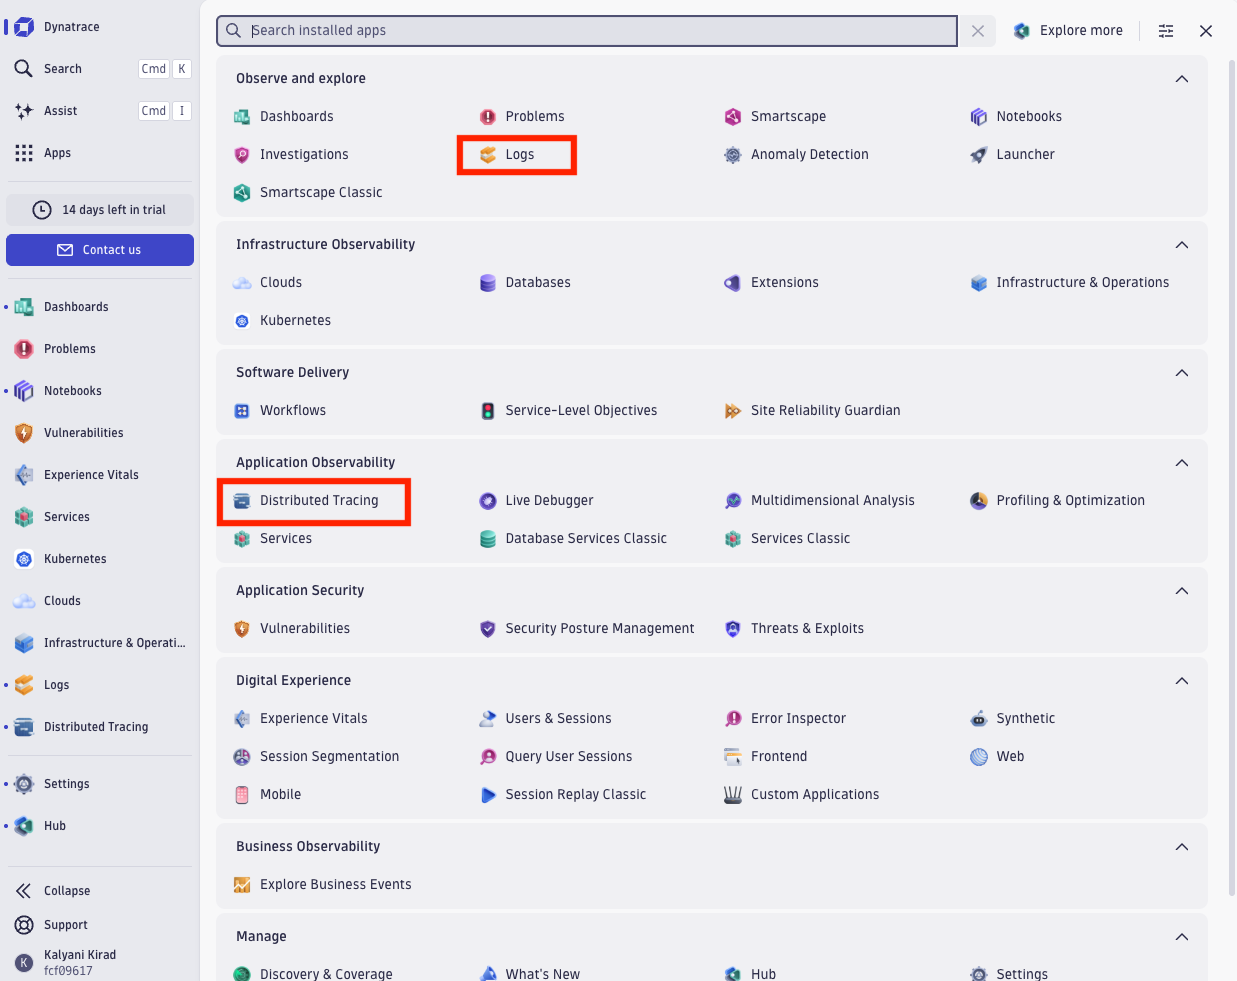
Logs
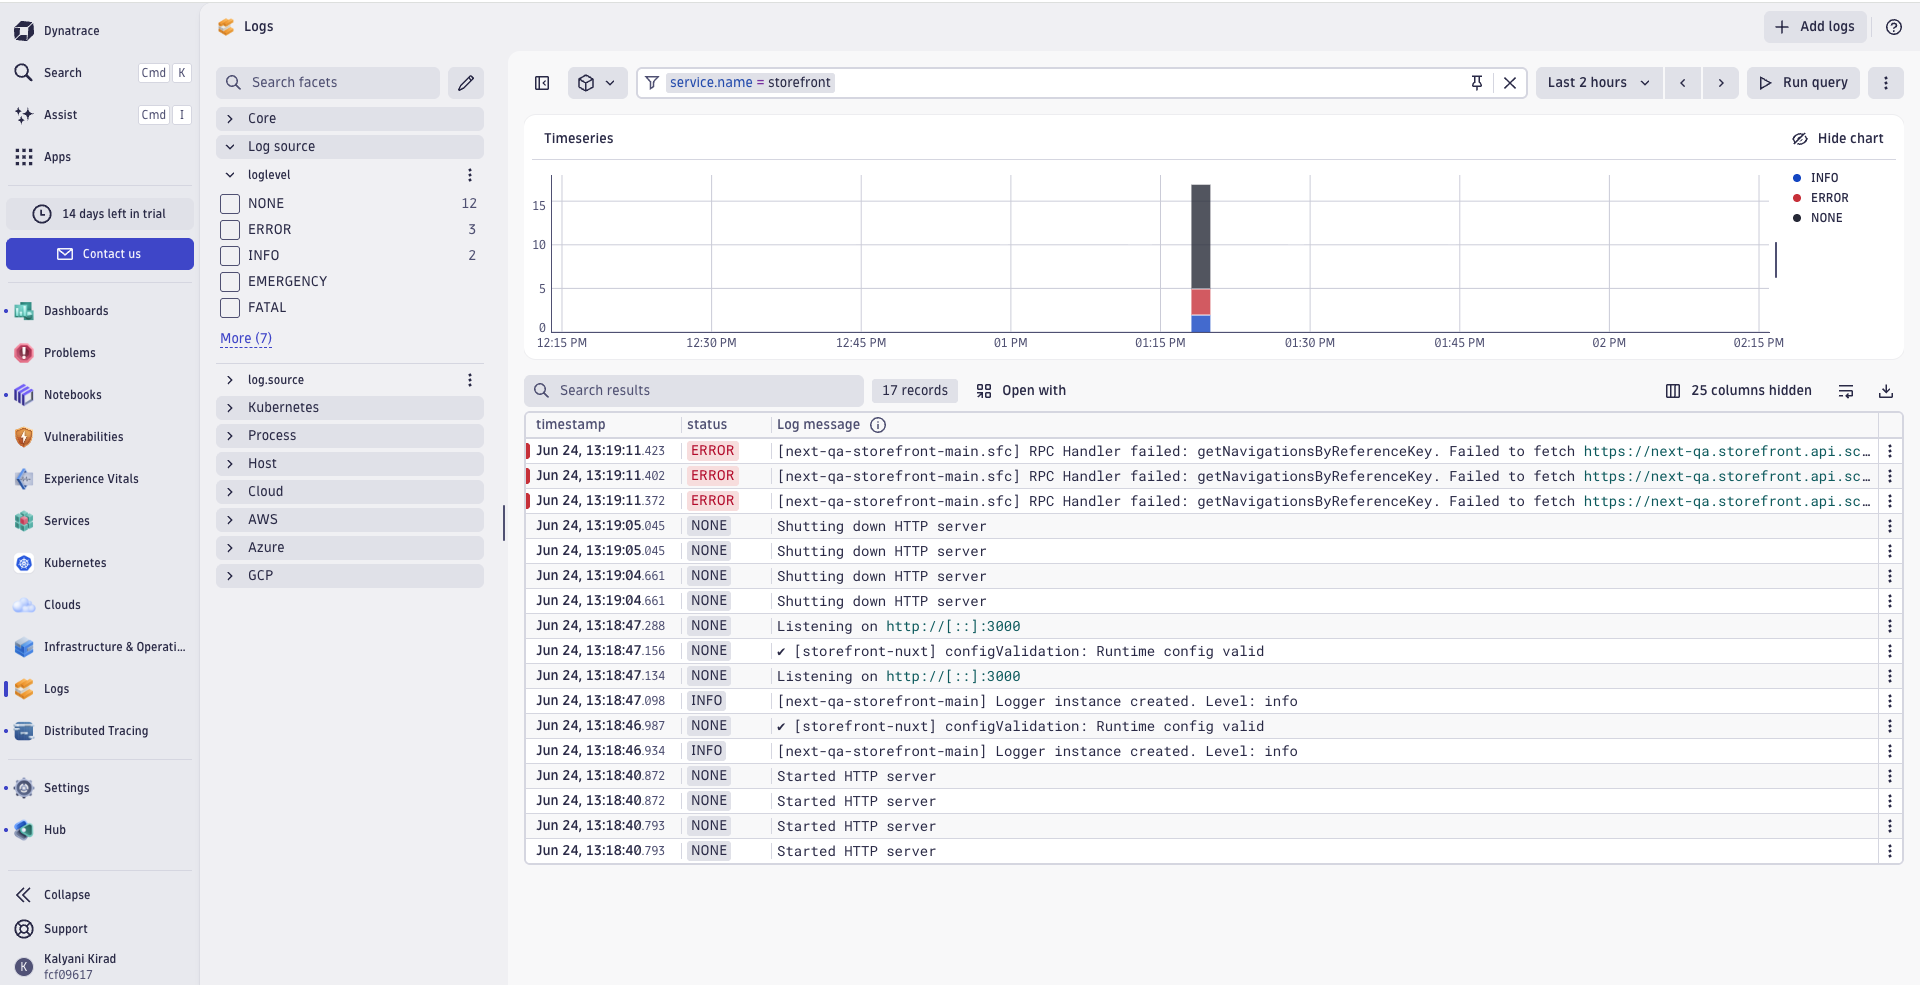
Logs from your Storefront Application are visible in the Logs app and queryable via DQL.
To find them via the Logs app:
- Open the Logs app from your Dynatrace home screen.
- In the filter bar, filter by
service.name = storefront. - Adjust the time range (top right) to cover the period you care about — first-time setup data may take a few minutes to appear.
To query via DQL in the Notebooks app:
Metadata attached to every log entry
SCAYLE enriches every log entry with standardized metadata so you can filter precisely. Useful fields:
scayle.platform.build.id- the ID of the build whose code produced the log.scayle.platform.deployment.id- the ID of the specific deployment running when the log was emitted.scayle.platform.env.key- the environment where the application was running (e.g., yourmainenvironment).scayle.platform.shop.key- the key of the shop within your SCAYLE setup.scayle.platform.tenant_space- the tenant instance within the platform.
Filter on any of these in DQL or the Logs app. For example, to see logs only from your production environment:
Traces
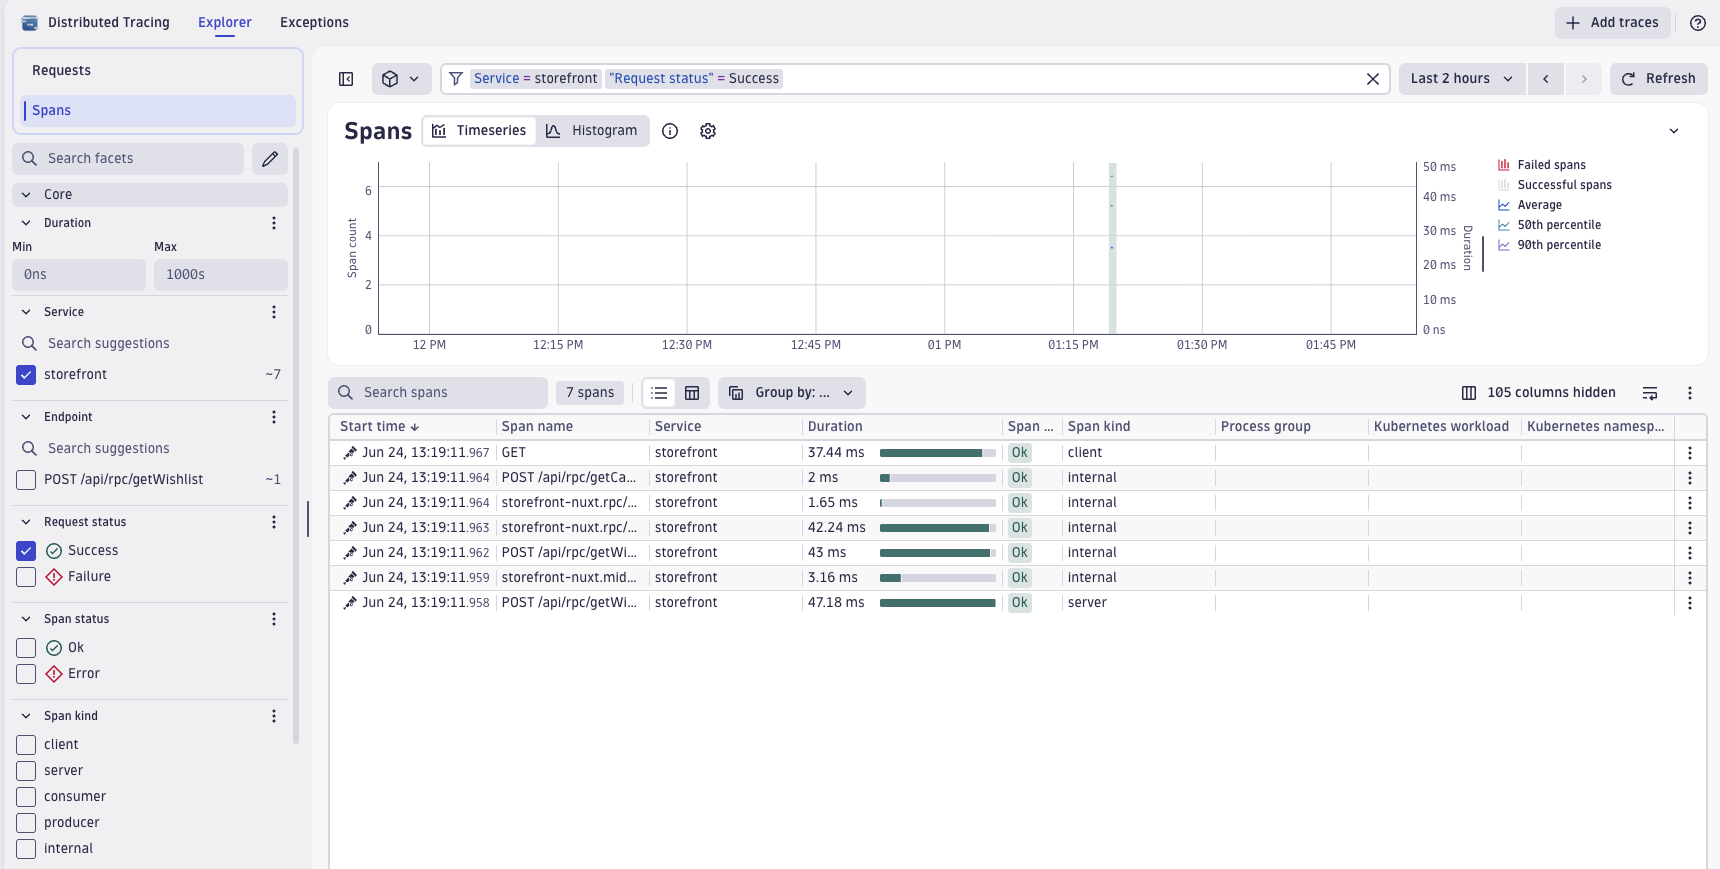
Performance traces (spans) for your Storefront Application show up in the Distributed Tracing app.
To find them via the Distributed Traces app:
- Open the Distributed Tracing app.
- Filter by service:
storefront. - Use the time range selector to focus on the period you're investigating.
To query via DQL:
Clicking on a trace opens a detailed view showing the full request flow, helping you identify performance bottlenecks or root causes for failed requests.
Metrics
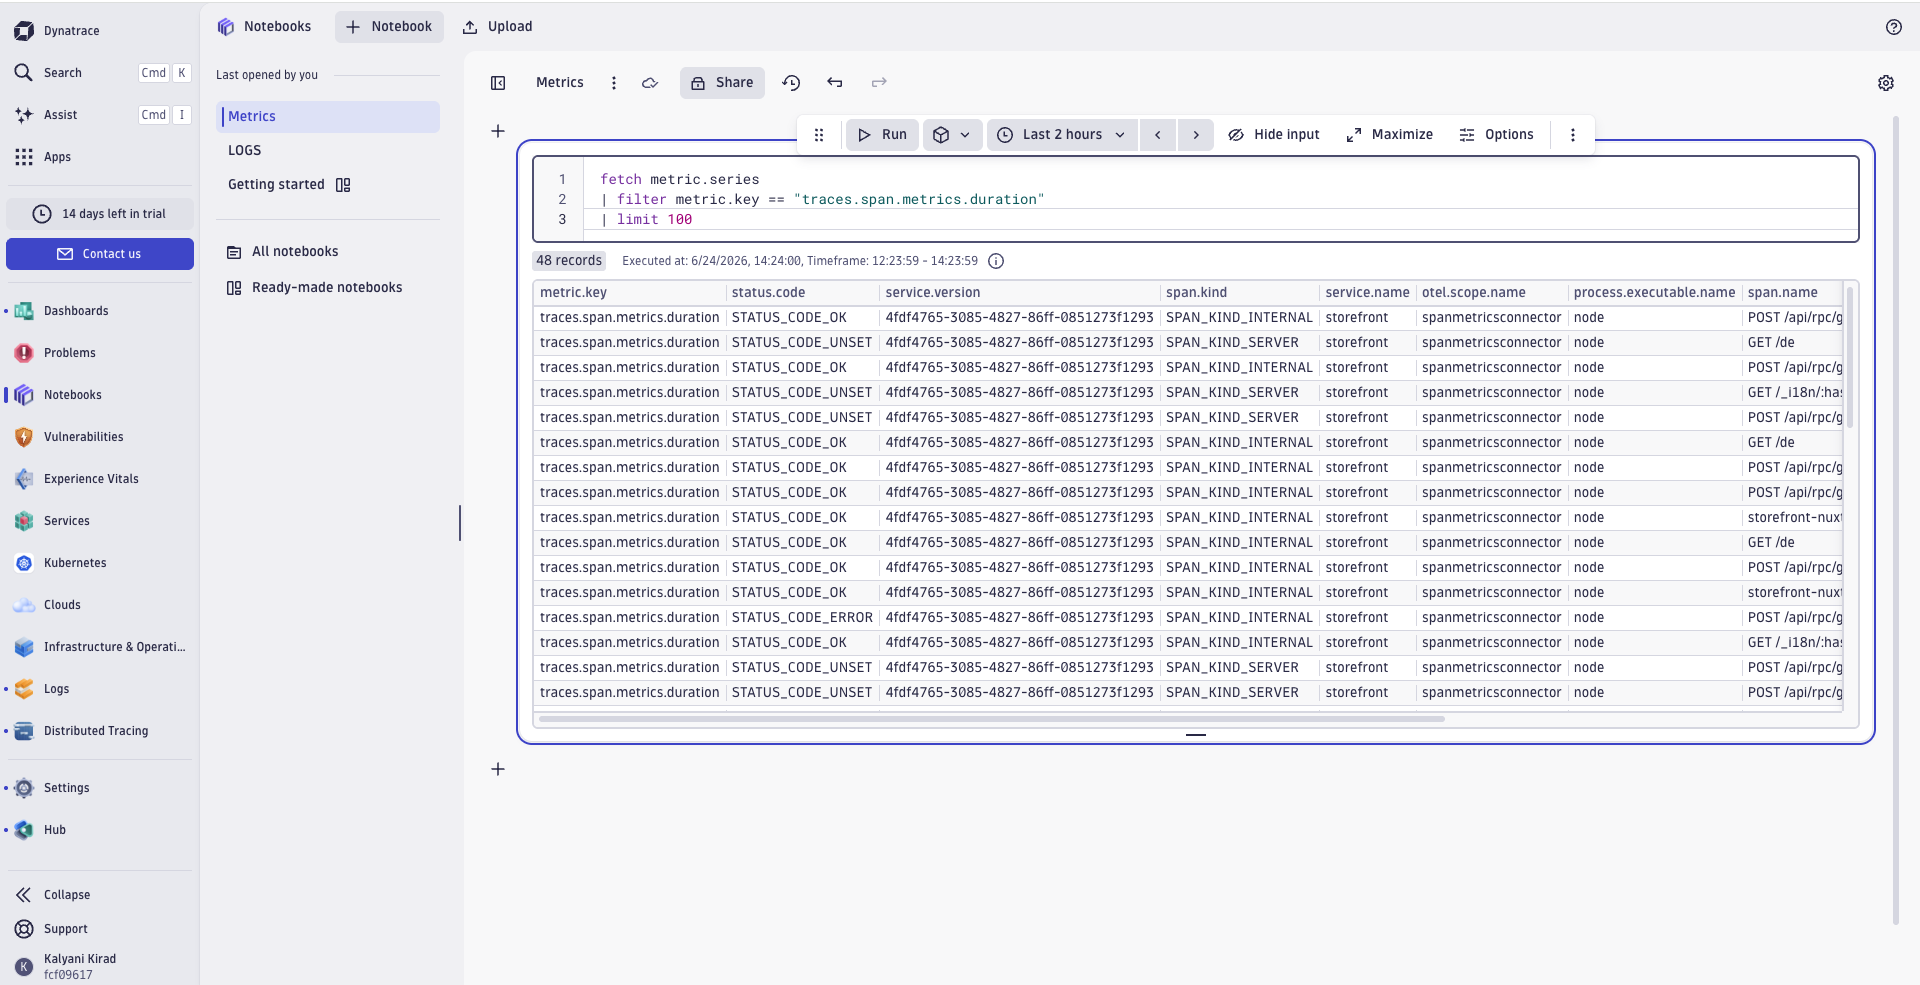
Metrics for your storefront are sent to Dynatrace and queryable via DQL in the Notebooks app. Available metric keys include traces.span.metrics.duration (with a _bucket variant for percentile calculations).
To list all metric keys available in your tenant:
To query the duration metric:
Useful dimensions on the duration metric: status.code, span.kind, span.name.
Prerequisites in Dynatrace
Dynatrace requires log ingestion to be enabled at the tenant level before any logs (OTLP or otherwise) will be ingested. If you see a "Logs ingestion isn't set up yet" message in the Logs app, click through Dynatrace's setup flow once to enable it. This is a one-time, tenant-level configuration and is separate from the SCAYLE integration.
You don't need to set up a Dynatrace OpenTelemetry Collector. SCAYLE's Monitoring Exporter sends data directly to Dynatrace's OTLP endpoint - no separate Collector deployment is required. If Dynatrace prompts you to configure an OpenTelemetry Collector in the setup flow, you can skip it.
Alerting
Dynatrace provides AI-powered automatic problem detection through Davis AI, so many alerting needs are handled without manual configuration. For custom alerting on specific metrics, error rates, or log patterns:
- Open the Settings app and navigate to Anomaly detection (or the equivalent for your Dynatrace tier).
- Configure thresholds for the metrics or events you want to be notified about.
- Connect a notification channel (email, Slack, PagerDuty, etc.).
For your Storefront Application, common alerts to consider:
- High error rate - sustained 4xx or 5xx errors on your storefront.
- Latency degradation - response times exceeding your acceptable threshold.
- Failed deployments - error spikes immediately after a new deployment.
Refer to Dynatrace's alerting and notifications documentation for full configuration details.


