

Insights
Overview
The Insights page (accessible via Shops ➜ [Shop] ➜ Hosting ➜ Observability ➜ Insights) provides near real-time visibility into the performance and stability of your Storefront Application. No configuration is required - SCAYLE collects metrics from the Storefront Application to give an objective view of your application's behavior.
The Insights tab sits alongside the Logs tab under Observability - Insights shows performance metrics, Logs shows real-time log output. Both share the environment selector at the top of the page.
Key Metrics
The Insights page shows core performance metrics - throughput, errors, and response time - along with detailed breakdowns by status code, country, and device.
View settings
Use the following controls to adjust what appears on the page.
- Timeframe Dropdown: Filter metrics by time range. Available options: 1 hour (default), 24 hours, 3 days, 7 days, 30 days. Changing the range refreshes all charts on the page.
- Environments Dropdown: Switch between environments configured for your shop. Each environment has its own metrics. Changing the environment refreshes all charts. To create or manage environments, see Environment.
Chart Features
All charts have two shared features:
- Hover interactions: Hover over any bar or point on a chart to see the exact metric value at that point in time.
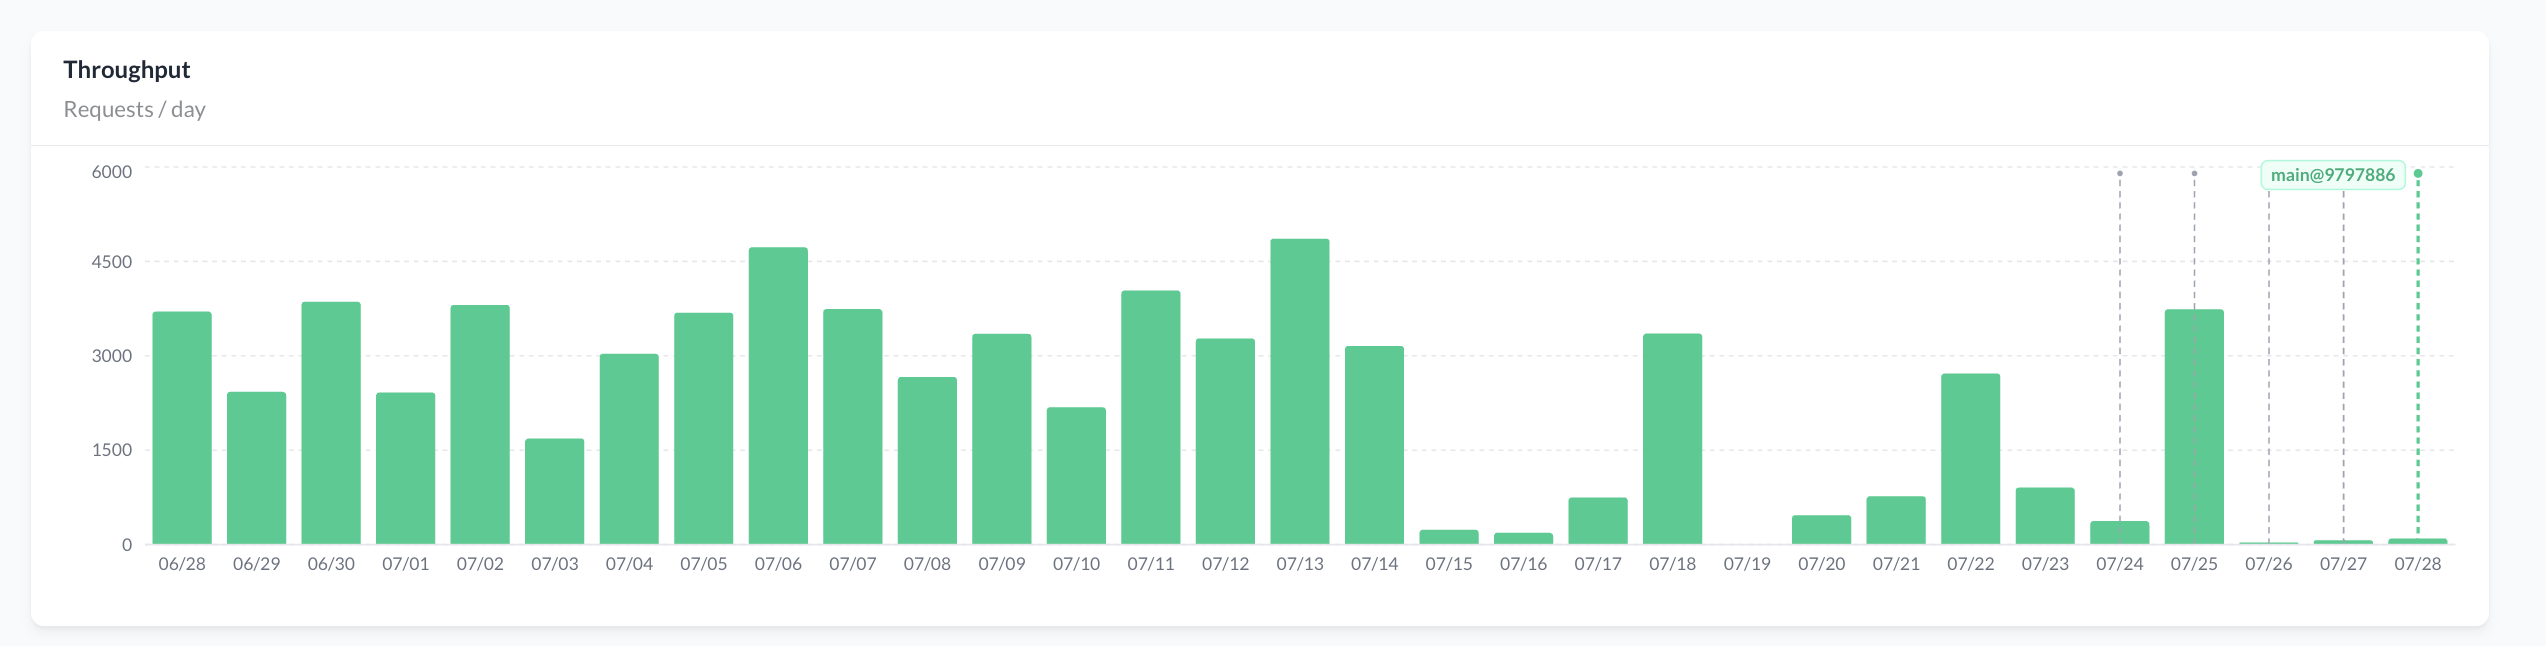
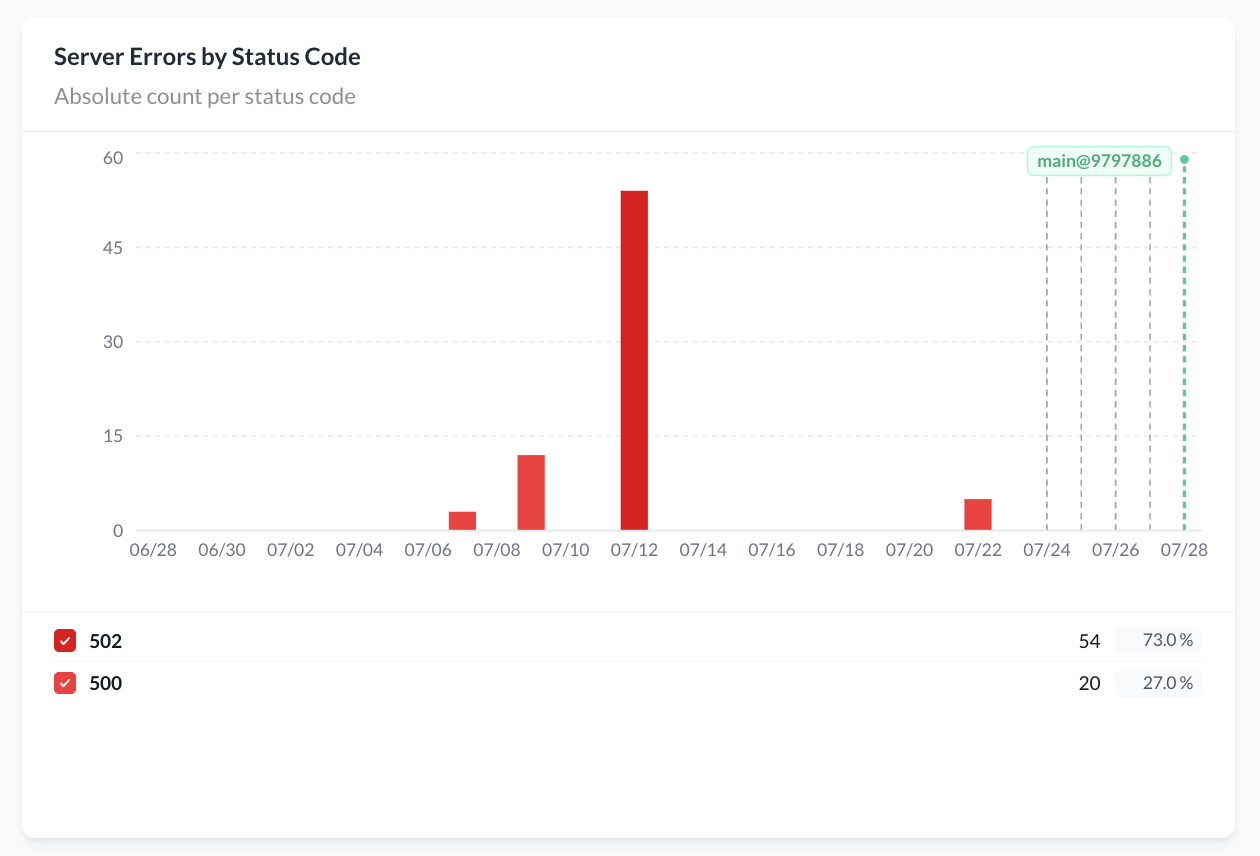
- Deployment markers: Every chart shows deployment markers on the timeline (e.g.,
main@9797886). Use these to correlate metric changes with releases - a spike in errors immediately after a marker points to a regression in that deployment.
Throughput
The total number of requests the Storefront Application processes in the selected time range. Use this to understand overall traffic patterns and identify unusual spikes or drops.
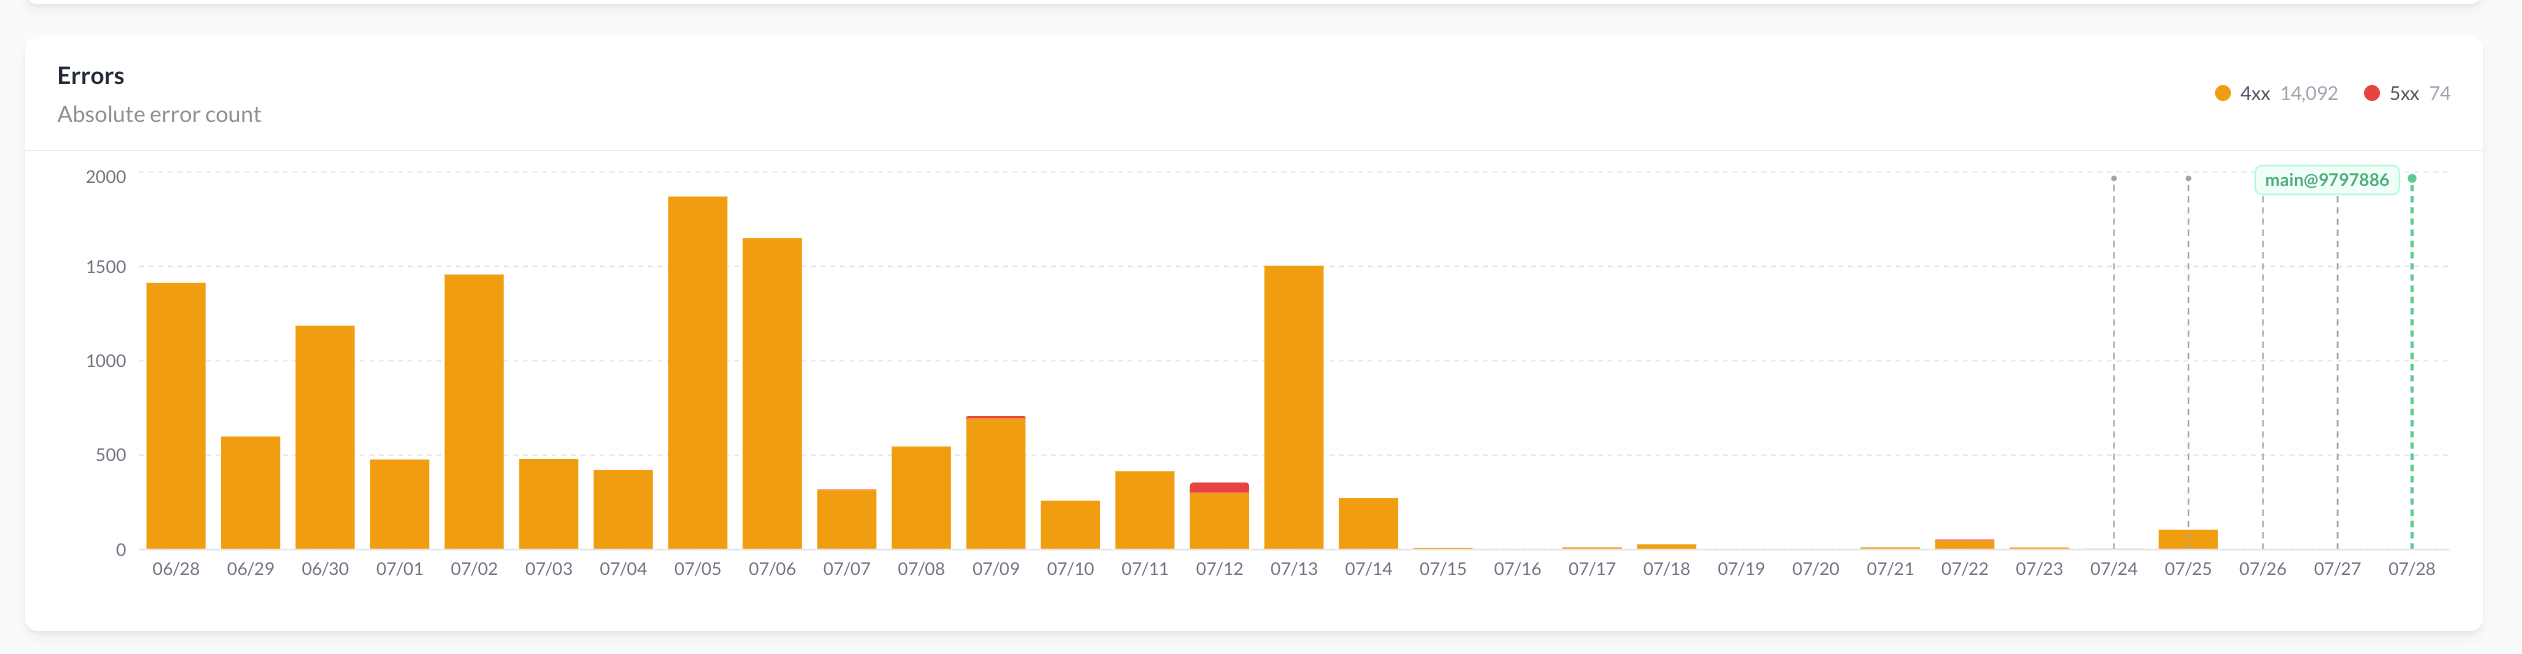
Errors
HTTP status codes returned by the Storefront Application, grouped as 4xx (client errors - e.g., 404 Not Found) and 5xx (server errors - e.g., 500 Internal Server Error). Use this to spot patterns, stability regressions, and outages.
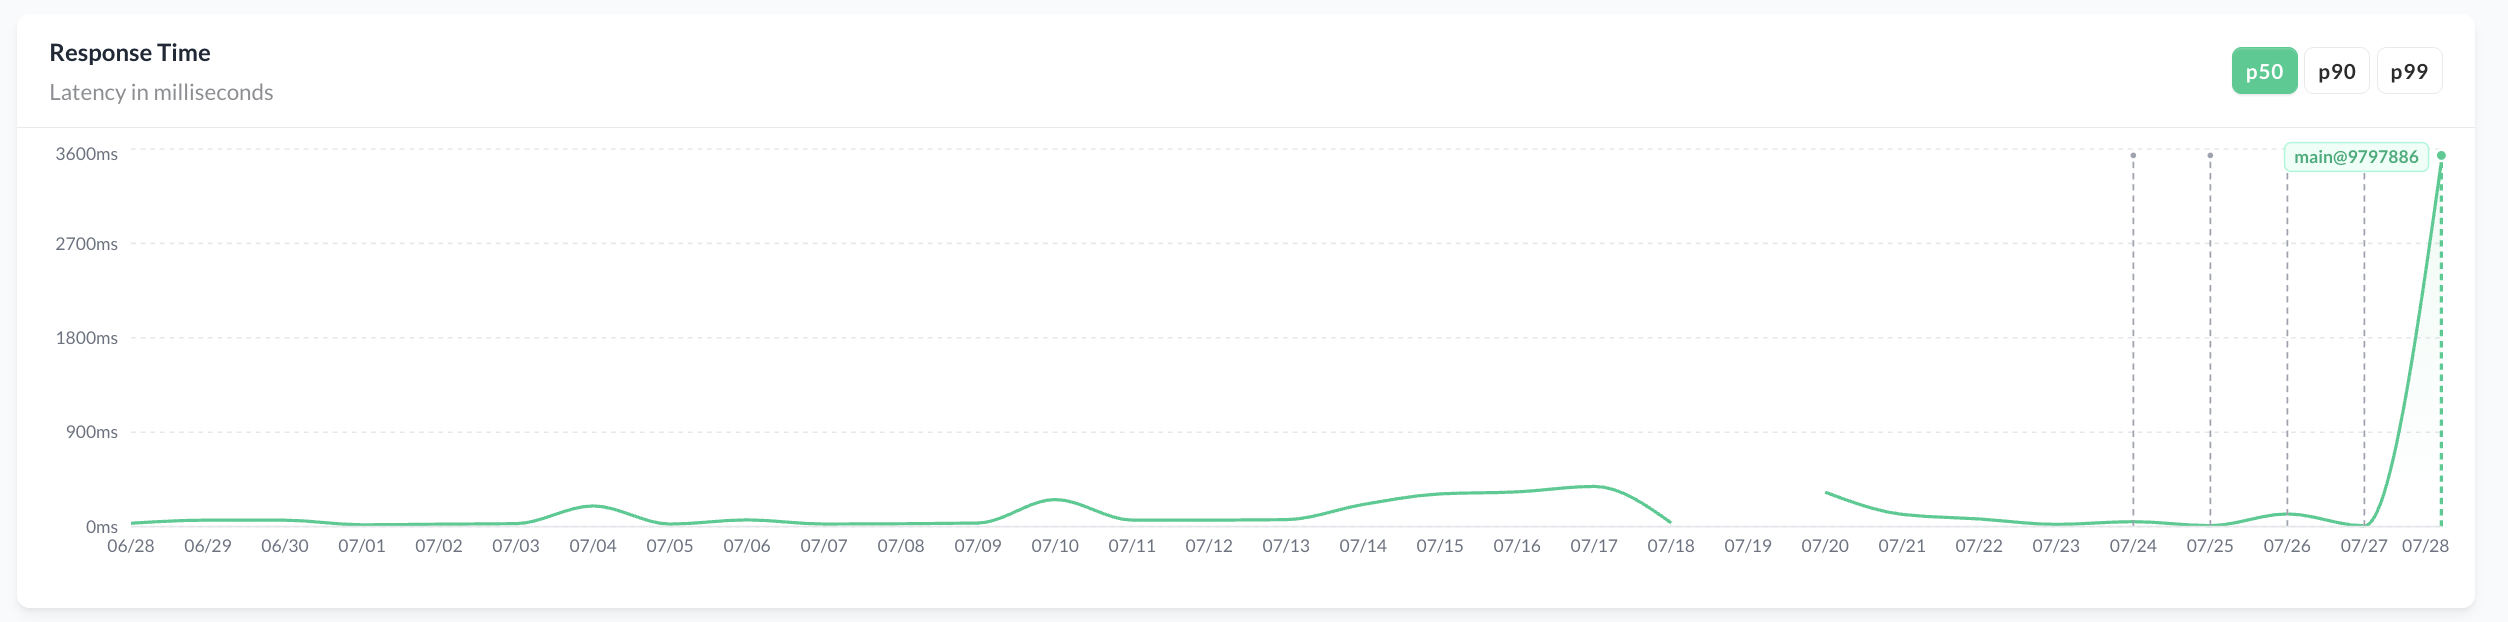
Response Time
How long the Storefront Application takes to serve a request, in milliseconds. View across the 50th (median), 90th, and 99th percentiles:
- 50th percentile (median) - a typical request. Half of all requests are faster; half are slower.
- 90th percentile - the slowest 10% of requests.
- 99th percentile - the slowest 1% of requests. Useful for understanding the worst-case user experience.
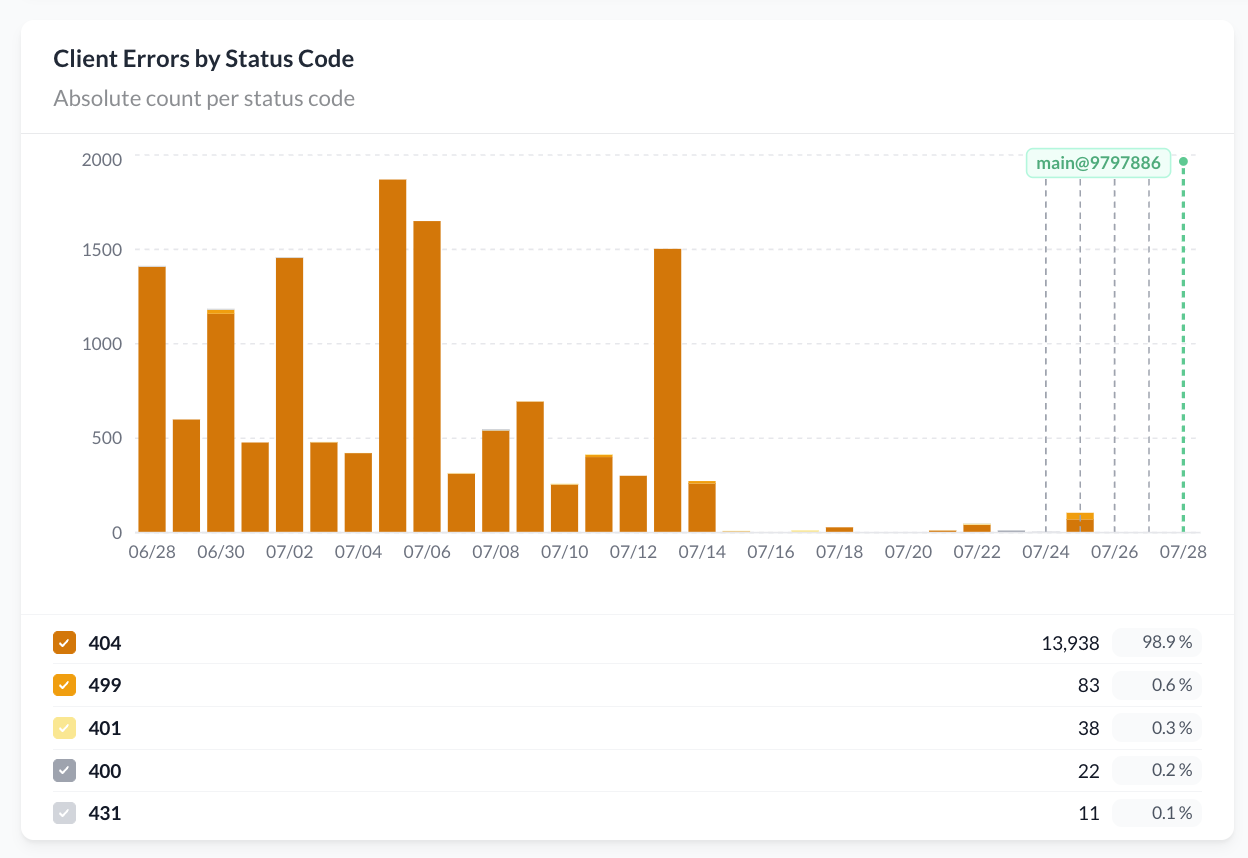
Client Errors by Status Code
The absolute count of client-side errors (4xx status codes) returned by the Storefront Application, broken down by individual status code. Common codes shown include:
- 400 Bad Request - malformed request from the client.
- 401 Unauthorized - request lacked valid authentication.
- 404 Not Found - the requested resource does not exist.
- 431 Request Header Fields Too Large - headers exceed server limits.
- 499 Client Closed Request - the client closed the connection before the server responded.
Use this to identify specific patterns - for example, a spike in 404s can indicate broken product links or missing content, while frequent 400s can suggest a client-side validation regression.
Toggle individual status codes on and off using the checkboxes below the chart.
Server Errors by Status Code
The absolute count of server-side errors (5xx status codes) returned by the Storefront Application, broken down by individual status code. Common codes shown include:
- 500 Internal Server Error - an unhandled error in the application.
- 502 Bad Gateway - an upstream service returned an invalid response.
- 503 Service Unavailable - the application is unable to handle the request.
Use this to detect regressions, outages, and problems with upstream dependencies.
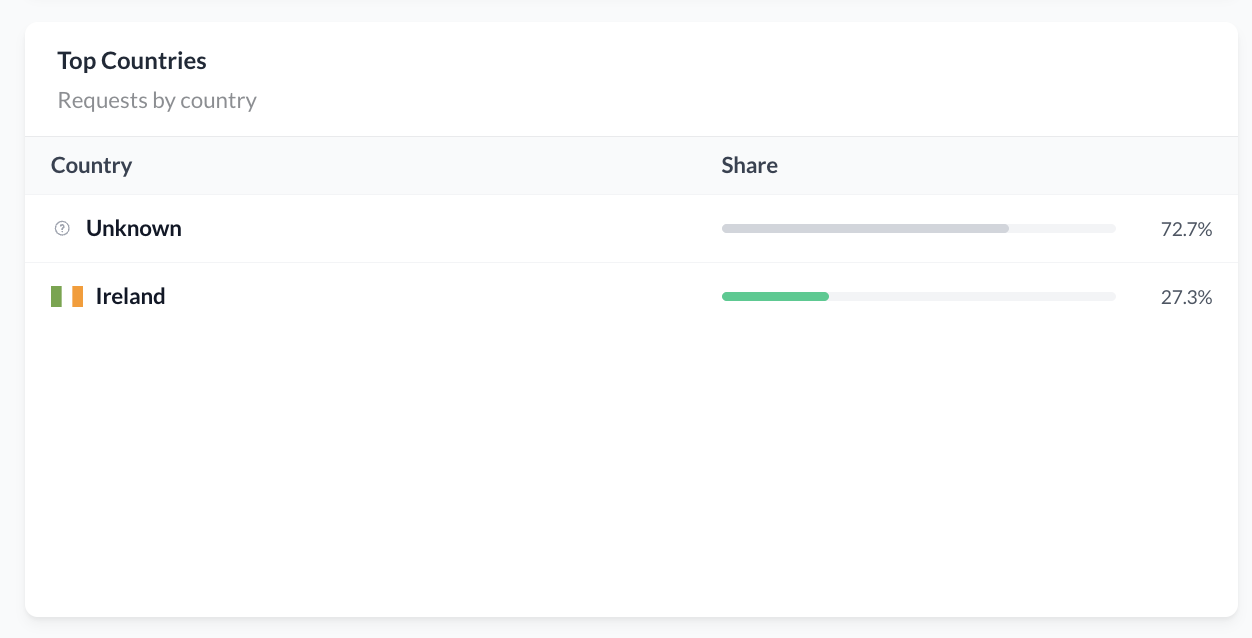
Top Countries
The distribution of incoming requests by country of origin, based on the request's source IP. The list shows the top countries and their share of total traffic.
Unknown appears when the country cannot be determined from the source IP (for example, from certain proxy or VPN configurations).
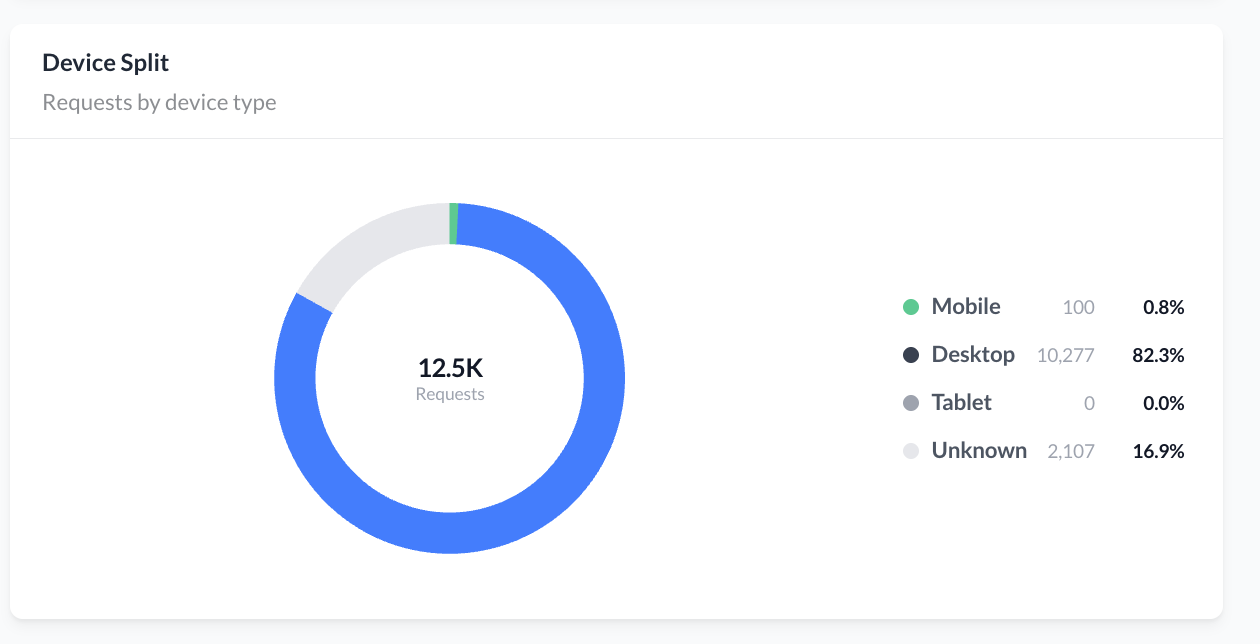
Device Split
The distribution of incoming requests by device type - Mobile, Desktop, Tablet, and Unknown. Device type is inferred from the User-Agent header on each request.
Use this to understand your device mix and prioritize performance optimization efforts (for example, focus on mobile improvements if mobile share is high).
Unknown appears when the device type cannot be reliably determined from the User-Agent.
Retention
Metrics are retained for 30 days. Data older than 30 days is no longer available in the SCAYLE Panel.


