

Application Logs
Overview
The Application Logs page (accessible via Shops ➜ [Shop] ➜ Hosting ➜ Observability ➜ Logs) shows the log output of your active Storefront Application deployment for the selected environment. Logs include console output from your application - errors, warnings, and informational messages - captured in real time. Use them to diagnose issues, verify deployments, and trace unexpected behavior.
The Logs tab sits alongside the Insights tab under Observability - Logs shows real-time log output, Insights shows performance metrics. Both share the environment selector at the top of the page.
Key Features
- Timeframe Dropdown: Filter logs by time range. Available options:
- Live - new log entries stream in automatically as they are captured, indicated by a red dot.
- Past 15 minutes
- Past 1 hour
- Past 1 day
- Past 3 days
Changing the range refreshes the list immediately. - Environments Dropdown: Switch between environments configured for your shop. Each environment has its own log stream. Changing the environment refreshes the list. To create or manage environments, see Environment.
- Application Logs Count: The counter next to Application Logs shows how many entries are available in the selected time range.
- Search: Filter visible logs by keyword. Search matches against log message content.
- Severity Filter: Filter by log level using the DEBUG, INFO, WARN, and ERROR pills. Each pill shows the count of entries at that level within the current timeframe. Click a pill to show only entries at that severity.
- Load Older Logs: Load entries older than what's currently visible. Useful in finite-range modes - in Live mode, new logs stream in automatically without needing to reload.
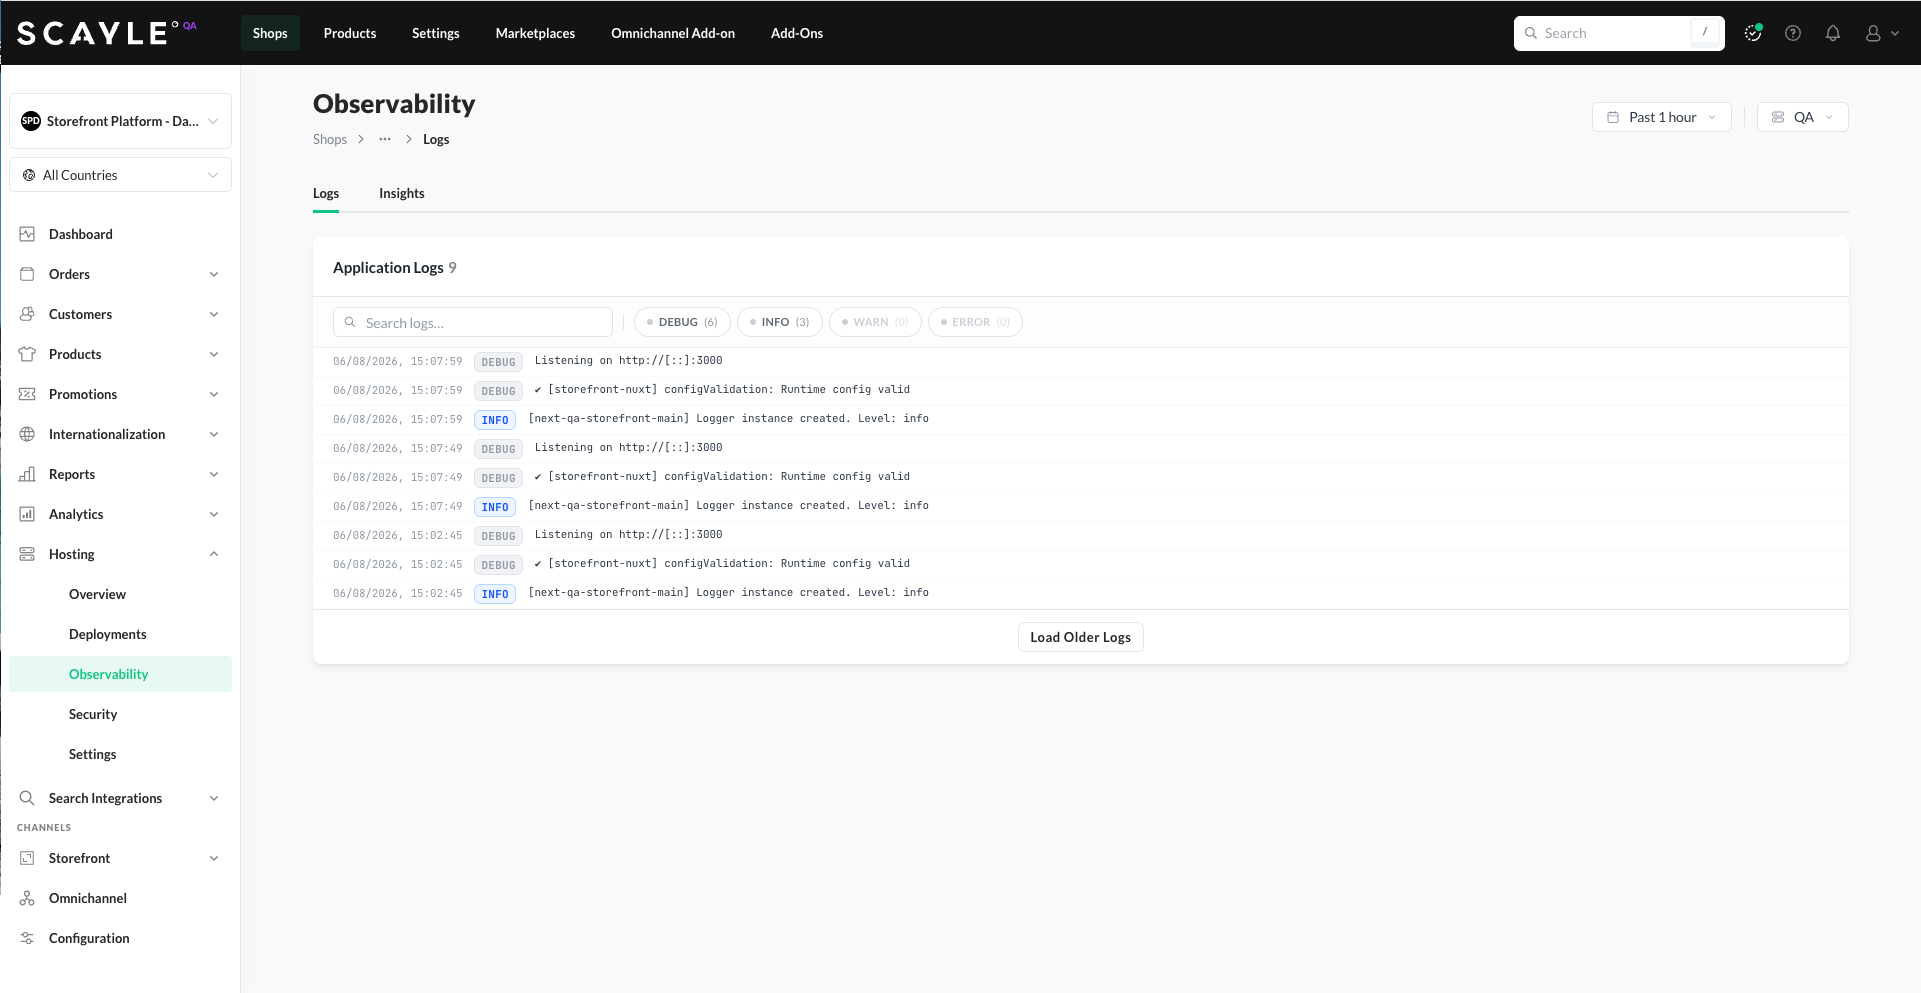
By default, we show the latest 100 log entries from the last hour.


