

New Relic
Overview
New Relic is an observability platform for monitoring applications, infrastructure, logs, and traces. The Storefront Hosting platform makes it easy to export your monitoring data to New Relic, giving you real-time visibility into your Storefront Application's performance and behavior alongside the rest of your stack.
To learn more about New Relic, visit their official documentation.
Set Up
When adding the New Relic exporter, you need to fill in two fields:
- Region: The New Relic region that matches your account - US (endpoint
otlp.nr-data.net) or EU (endpointotlp.eu01.nr-data.net). The region determines the OTLP endpoint used to send data. - API Key: A New Relic License Key (also called an Ingest License Key). See New Relic's documentation on API keys for how to create one.
Use a License Key, not a User API key or Query key. The API Key field expects an Ingest License Key. Using a different key type will cause the connection to fail.
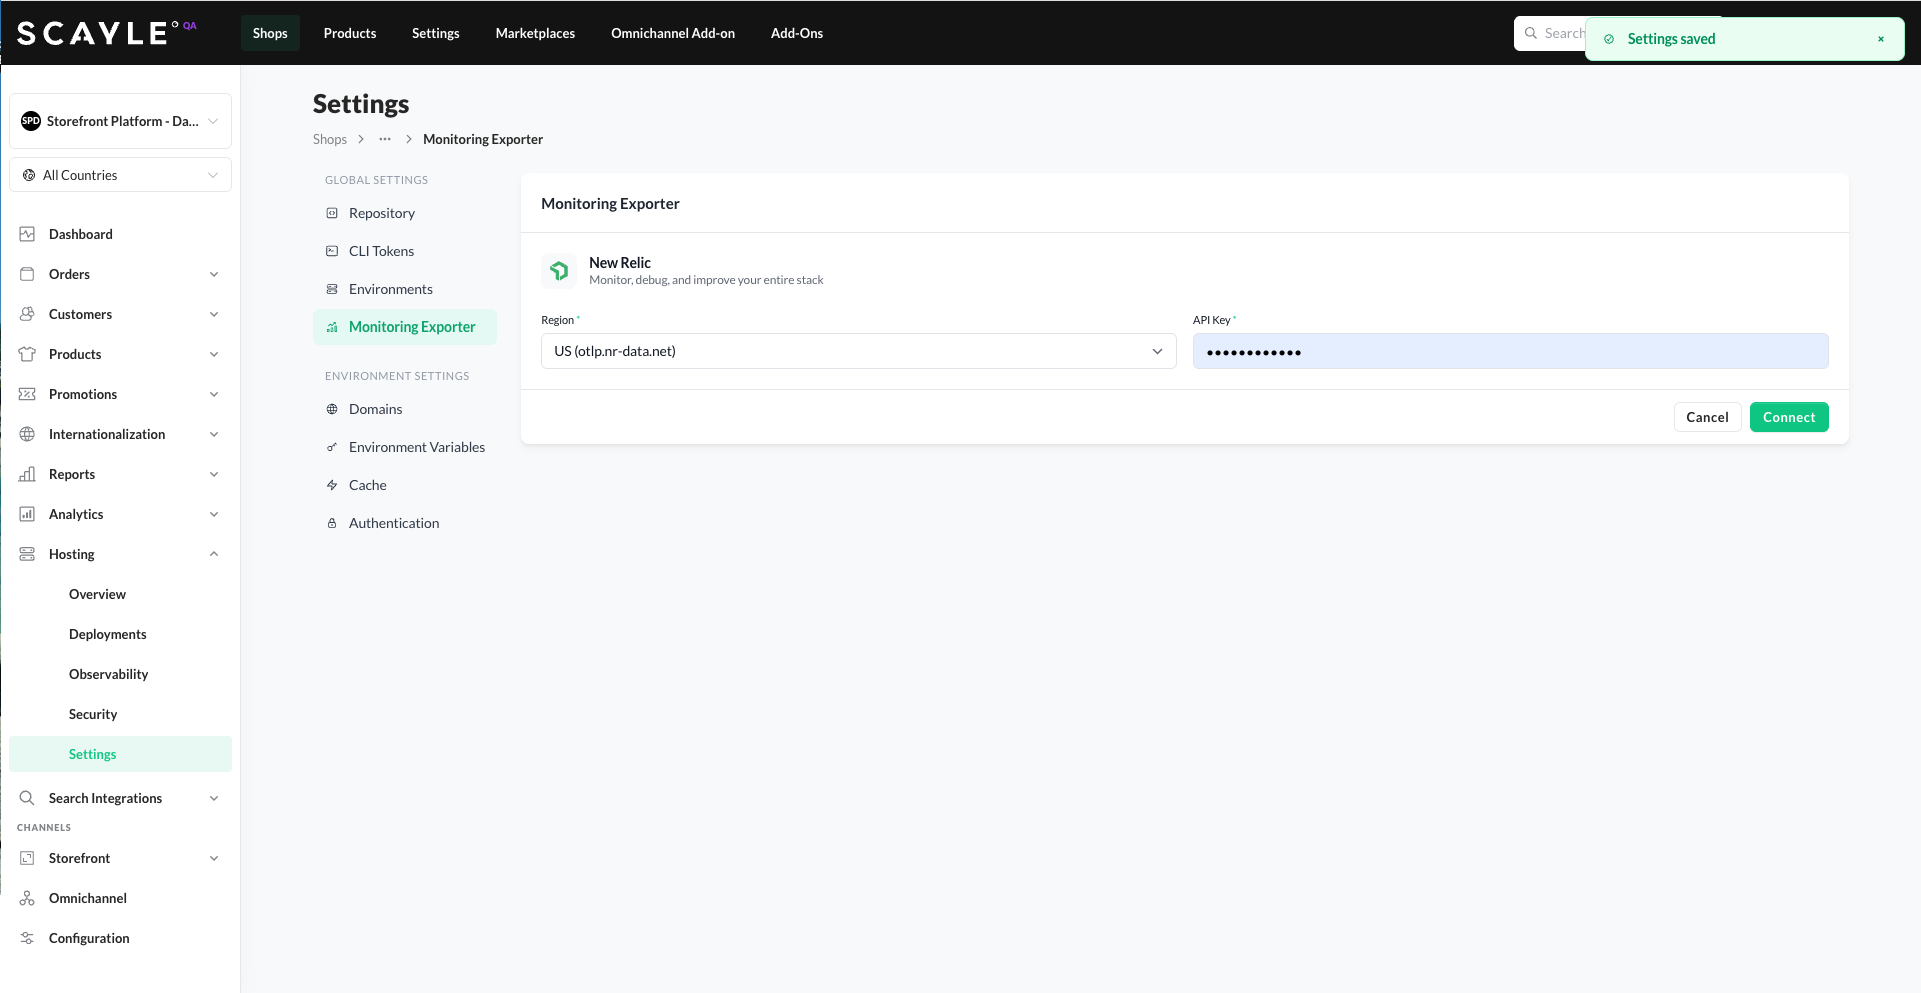
After successfully connecting to New Relic, SCAYLE will start sending all collected monitoring data - logs, metrics, and traces - to your New Relic account.
To find your data, filter for the default Service Name of your Storefront Application, which is storefront.
Finding your data in New Relic
Once the integration is live and your storefront has traffic, your telemetry data appears in New Relic under the service named storefront (or whatever Service Name you configured in SCAYLE's Telemetry Settings).
Each data type has its own view in the New Relic UI, and everything can also be queried through NRQL (New Relic Query Language).
Logs
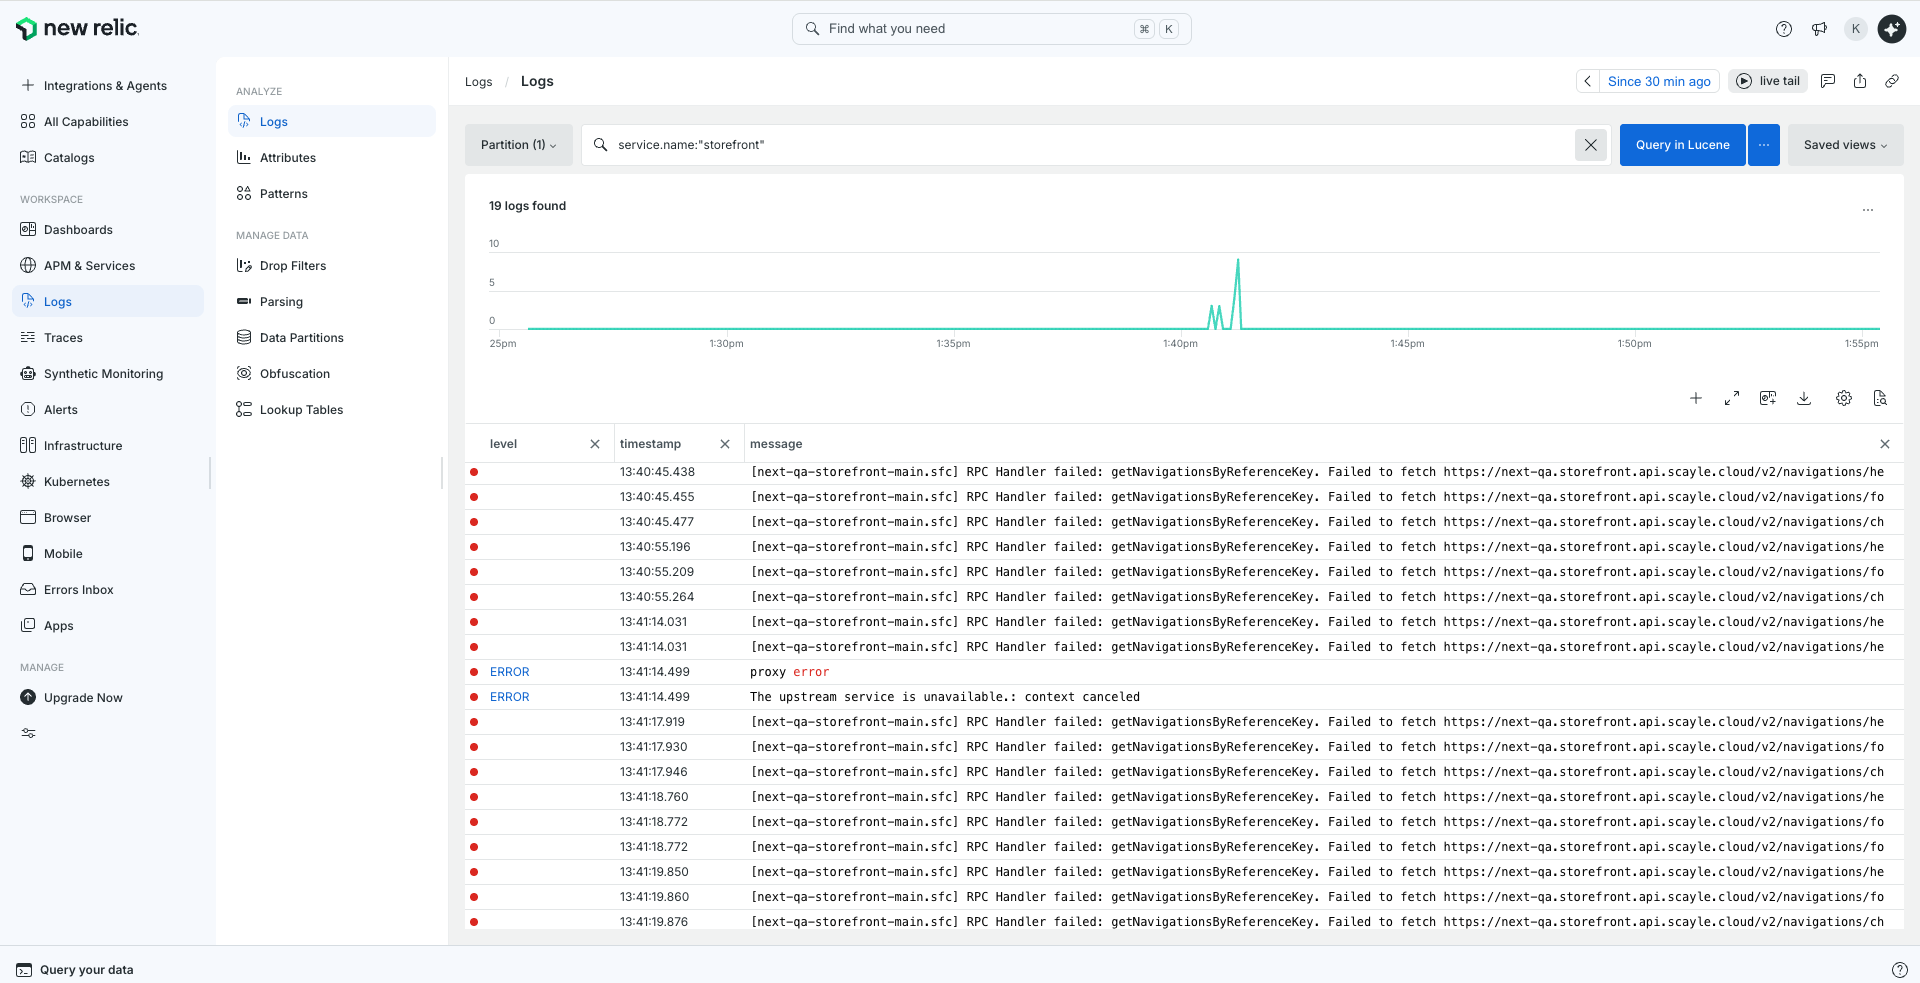
Logs from your Storefront Application are visible in the Logs view.
To find them via the Logs app:
- Open the Logs view from the New Relic left navigation.
- In the query bar, filter by
service.name:"storefront". - Use the time range selector to focus on the period you're investigating.
- Click live tail in the top right for a real-time stream.
To query via NRQL:
Traces
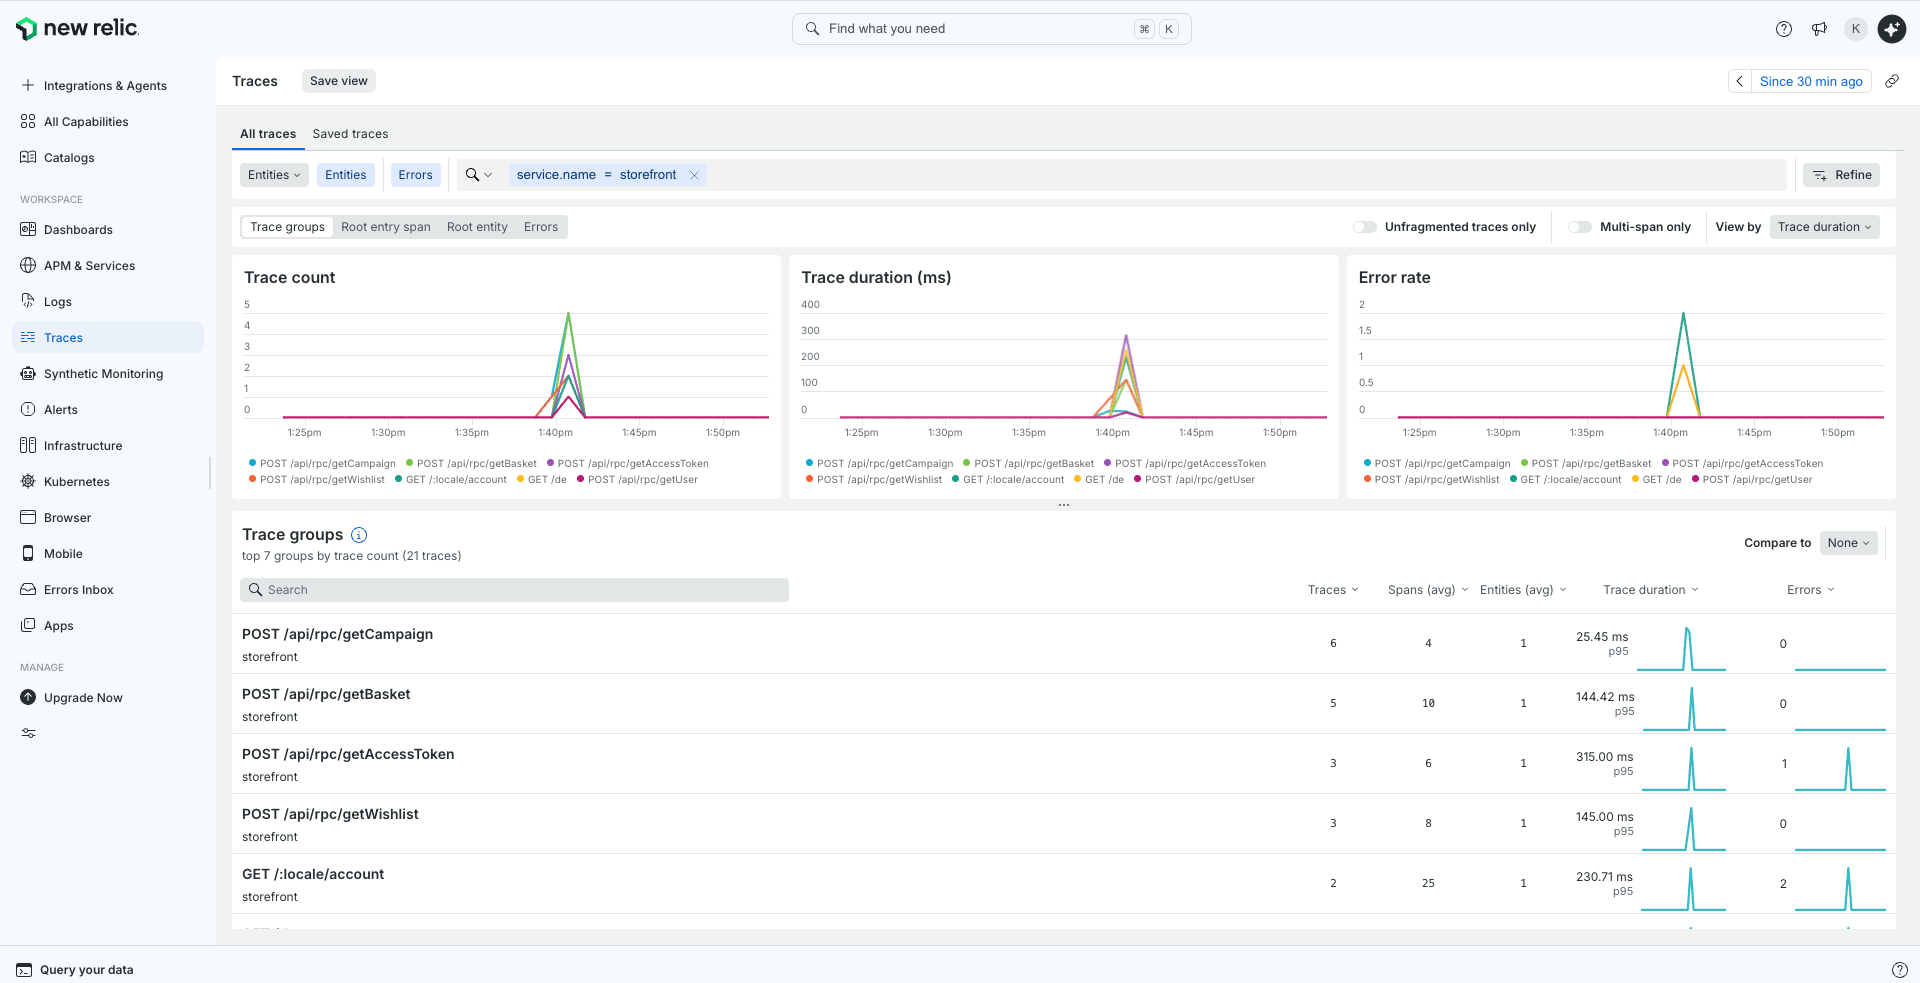
Performance traces (spans) for your Storefront Application appear in the Traces view.
To find them via the Traces app:
- Open Traces from the New Relic left navigation.
- Add a filter for
service.name = storefront. - Use the time range selector to focus on the period you're investigating.
Each trace group shows trace count, average span count, trace duration (p95), and error count. Click a trace group to see individual traces and drill into span-level detail - helpful for identifying performance bottlenecks or root causes of failed requests.
To query via NRQL:
Metrics
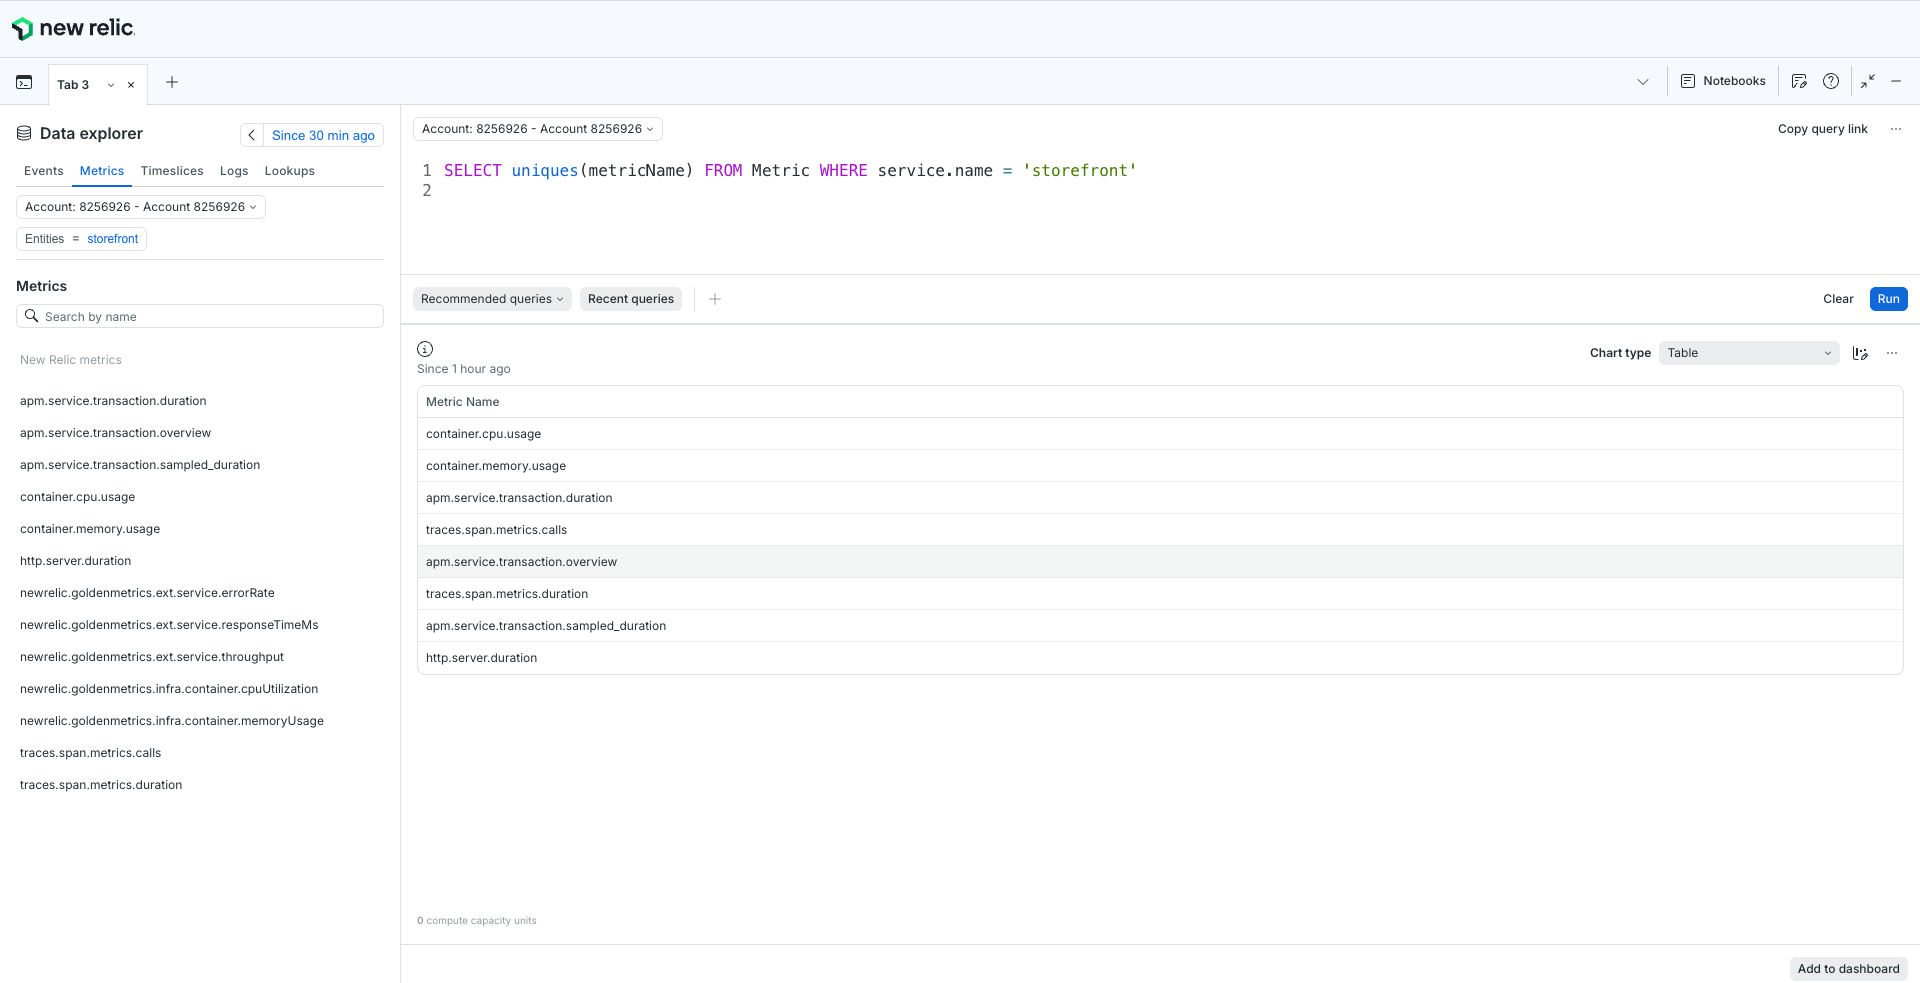
Metrics for your storefront are sent to New Relic and queryable via NRQL.
To list all metric names available for your service:
To aggregate a metric (for example, average or percentile of a duration metric):
Depending on the metric type (counter, gauge, histogram), you may need different aggregation functions such as average(), sum(), percentile(), or latest(). See New Relic's NRQL Metric reference for the full syntax.
Metrics also appear under APM & Services for your storefront entity, where you can view built-in charts and dashboards without writing NRQL.
Alerting
New Relic supports alerts on any data type you're ingesting - logs, metrics, and traces. You can create alerts from NRQL queries or from pre-built conditions in the Alerts section of the New Relic Panel.
Common alert conditions for a Storefront Application include:
- Error rate spikes - alert when
5xxresponses exceed a threshold over a rolling window. - Response time regressions - alert when the p95 or p99 of your request duration metric breaches a target.
- Log-based alerts - alert on the count of ERROR-level entries from your Storefront Application.
See New Relic's Alerts documentation for the full alert configuration reference.


