

Errors and Logging
What happens when something fails, and how do you find it? Two handlers registered in src/server/index.ts decide what the browser gets: createStorefrontErrorHandler() catches everything that throws during a request, and createStorefrontNotFoundHandler() answers paths that match no route. The error handler writes one structured log line per failure, so a stack trace never reaches the browser in production. Everything else you log yourself, through createLogger.
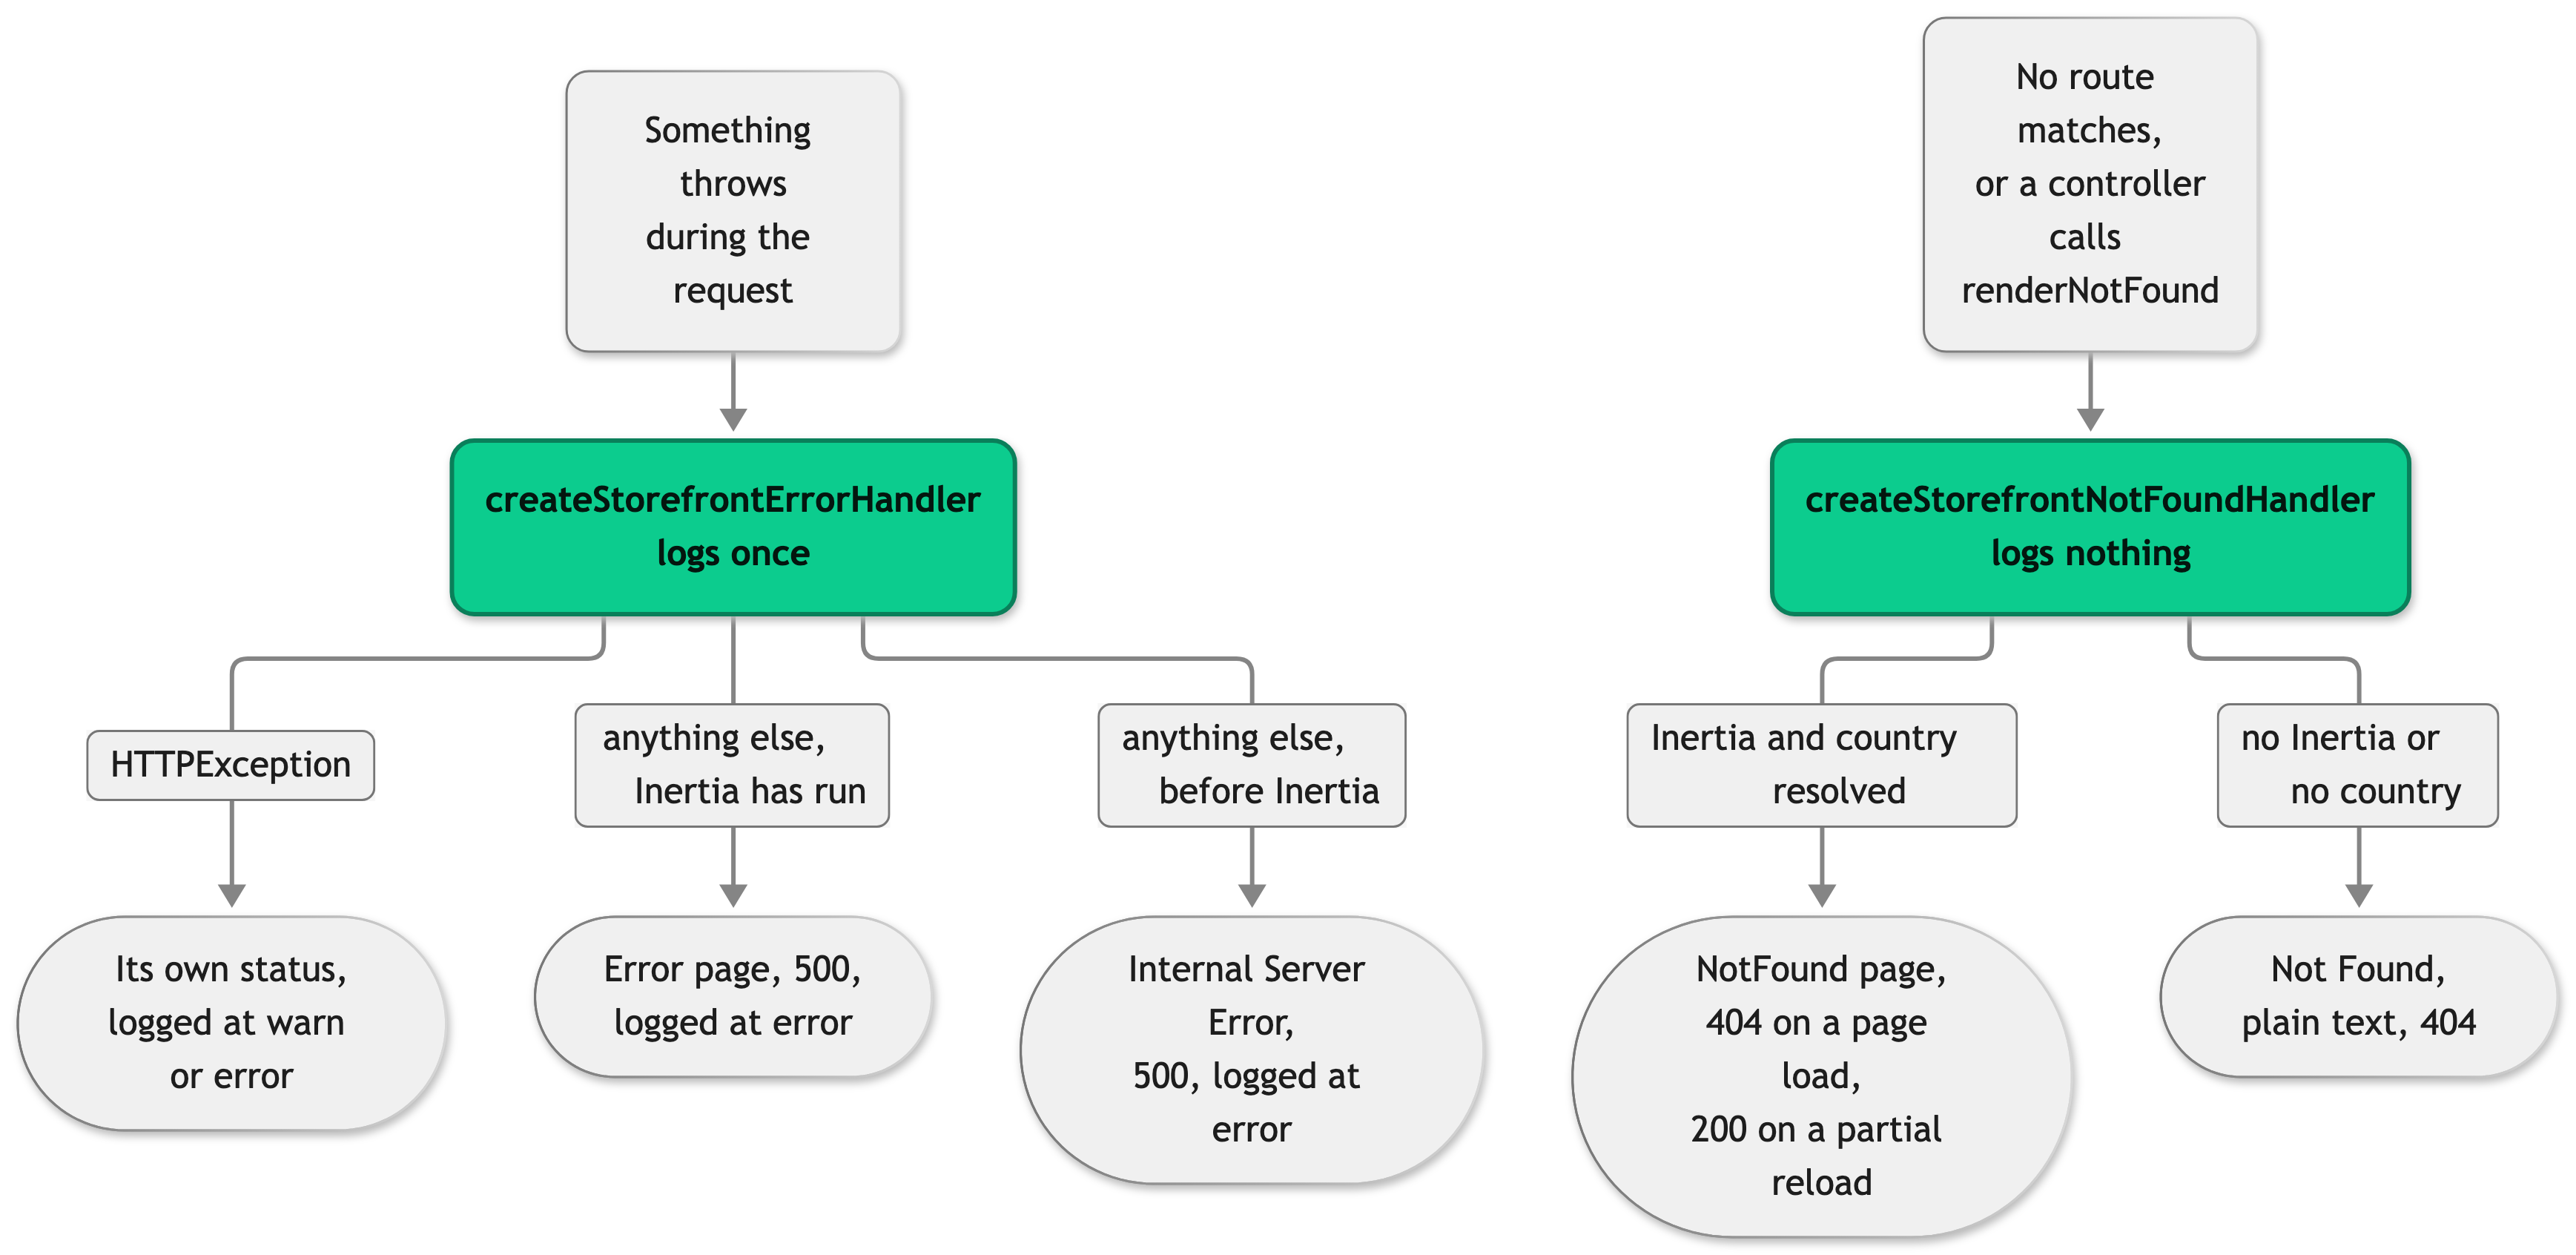
Both handlers are yours to replace: they are plain Hono handlers, registered with app.onError(...) and app.notFound(...) at the top of src/server/index.ts.
Failing pages
The error handler takes three paths, and the one it picks depends on what was thrown and how far the request got.
An HTTPException keeps its own status. A throw new HTTPException(401) from your own middleware answers 401 rather than 500, so an auth redirect or a rate limit stays what you meant it to be.
Anything else answers 500 and renders the Error page in src/client/pages/Error.vue. That page is deliberately bare. It opts out of the default layout with defineOptions({ layout: undefined }), and the handler renders it with shared props excluded, so it holds no navigation, no footer, and no basket. The reason is the failure case itself. A shared prop that throws is a common cause of a 500, and re-running those callbacks to draw a layout around the error message would throw a second time. The page reads the active locale, so its copy still translates, and a basePath prop for the home link. renderErrorPage sets both, so a direct ctx.render('Error', ...) call must pass basePath itself.
In development, a 5xx on a real Error also carries a Youch report, rendered in a sandboxed iframe behind a "Technical error details" button. It is built only when import.meta.env.DEV is true, so production leaks no stack to the browser. The report leaves out the headers and query parameters that the logger masks, STOREFRONT_LOG_REDACT_KEYS included, so you can paste it into an issue.
When the error happens before the Inertia middleware ran, there is nothing to render a page with. The handler answers the plain text Internal Server Error with a 500 and still logs the full cause.
Not-found pages
A path that matches no route reaches app.notFound(...), which renders src/client/pages/NotFound.vue with a 404. Unlike the error page, this one renders with shared props, so it keeps your layout and navigation. It falls back to the plain text Not Found when the request has no Inertia instance or no storefront context, because without a country there is no locale and no shared data to render with.
The base page controllers that can miss, such as product detail, product listing, search, and the CMS pages, call renderNotFound(). Its default implementation calls this.ctx.notFound(), so a missing product and an unmatched URL answer through the same handler. Override renderNotFound() on one controller to change the 404 for that page, or replace the handler in src/server/index.ts to change it everywhere.
To answer a 404 for a case of your own, return this.ctx.notFound() from a hook such as beforeRender(). The subscription cancellation page does it for a shop country that lacks the subscription addon:
On a base controller with a not-found case, return this.renderNotFound() instead, so an override of it applies to your case too. For a failure, renderErrorPage(this.ctx, { error, statusCode }) from @scayle/storefront renders the error page with any 4xx or 5xx status except 404.
The 404 belongs to the page load, so the partial reloads that follow it (the deferred shared props, such as the basket) answer with 200. An httpException handler that cancels 4xx responses for the current URL would otherwise drop those props and leave the page half-rendered.
Not-found responses are not logged, with one exception: a CMS page controller logs a missing CMS entry before it renders the not-found page, at warn level when the provider returns no page and at error level when the provider throws a content-not-found error. Count all other not-found responses in your access log or your traces.
How failures are logged
The entry the handler writes
The error handler writes exactly one entry per failure, under the storefront:server namespace:
The level follows the status. A status of 500 or above logs at error, anything below logs at warn. An error with no HTTP status counts as a 500. Reserve error level for failures that reached the user explains why the split matters for alerts.
oRPC errors
The oRPC error contract, the typed codes a procedure declares and how the browser handles them, is on RPC API. The logging side sits in src/server/index.ts, where mountAPIRouter takes an onError interceptor:
UNAUTHORIZED and TOO_MANY_REQUESTS stay at warn because both are routine, as described under Reserve error level. The check reads the error code rather than matching a class, so it still works after the error crossed the RPC boundary and lost its prototype. Add a code of your own to the list when your procedures start throwing something equally routine.
Logging from your own code
Create one logger per domain at module level and reuse it:
createLogger prefixes the namespace with the root name, so basket becomes storefront:basket in the output. Name it after the domain, in kebab-case, and keep it to a single segment so the full name stays two levels deep: basket, search, product-detail. Keep the name stable once you pick it, because it is what you filter on later.
Pass a single object. tslog merges one object flat into the entry, so message, err, and your own fields all land at the top level. Passing several arguments instead puts them under the numeric keys "0", "1", and so on, which breaks every filter you would want to write.
The same import works in src/client/. See In the browser for the differences.
Format and levels
The default output is one JSON object per line, in every environment. STOREFRONT_LOG_FORMAT=pretty switches to tslog's human-readable writer, and the shipped .env.example sets it, so local development reads as colored lines while a deployment emits JSON. The format does not depend on NODE_ENV: unset the variable in development and you get JSON there too.
A JSON line carries timestamp (ISO 8601), severity (the lowercase level), logger (the namespace), and your own fields merged flat beside them.
STOREFRONT_LOG_LEVEL sets the minimum level, and accepts debug, info, warn, or error. The default is info, so log.debug(...) writes nothing until you ask for it. An unrecognized value falls back to info rather than failing the boot.
Both variables are read once, when the first logger is created, and cached for the life of the process. Since a logger is usually created at module level, that happens at startup. Changing either one needs a restart.
The logger exposes tslog's full set of level methods, from silly to fatal, but only the four above can be selected through the environment variable.
Redaction
Values under a sensitive key are replaced with [REDACTED] before anything is written:
The built-in list covers credential names such as password, token, secret, jwt, authorization, cookie, apiKey, accessToken, refreshToken, and sessionId, and personal data names: email, phone, firstName, lastName, and street. Add your own as a comma-separated list, which merges with the built-in list rather than replacing it:
In the JSON format, matching ignores case and ignores -, _, and ., so access_token and accessToken are the same key. A key is also masked when its name contains token, secret, password, jwt, cookie, authorization, apikey, or sessionid, so checkoutJwt is masked without being listed. The personal data names and the keys you add match the whole name only: email is masked and customerEmail is not. List such a key in full when it has a prefix or a suffix.
The pretty format masks only the listed keys, compared without case. It skips the normalization and the name fragments, so checkoutJwt is not masked there. Started with NODE_ENV=production, the pretty format logs a warning that says so. Use the JSON format in production.
In both formats, the logger also masks the value of a sensitive query parameter inside a logged string, such as a URL in an error message, the user and password in a URL like https://user:password@host/, and a token of 20 or more characters after Bearer. Redaction is a safety net for a field that slipped through, not a license to pass secrets to a logger on purpose.
Linking a log line to a trace
A log line written inside an active OpenTelemetry span carries trace_id and span_id automatically, so your observability platform can jump from the line to the full trace. You add nothing to the call:
A span that carries an invalid context, which happens when a malformed traceparent header arrives, is dropped rather than written, so the ids never point at a trace that does not exist. Do not propagate a requestId field by hand: it duplicates what trace_id already gives you and does not survive into the traces themselves. OpenTelemetry covers the span tree and its attributes.
In the browser
createLogger also runs in src/client/, where it returns a lightweight logger bound to the native console methods. Three differences matter:
- Nothing is redacted. The redaction list is server-side only, and console-capture tools in error-reporting SDKs record whatever you log.
- The level stays at
infoand the format is always the console.STOREFRONT_LOG_FORMAT,STOREFRONT_LOG_LEVEL, andSTOREFRONT_LOG_REDACT_KEYSare read fromprocess.env, which the browser does not have, so the level resolver falls back to its default andlog.debug(...)writes nothing. - Output is not collected by your log aggregator, because it never leaves the user's browser.
So never pass a token, a JWT, or any other secret to a logger in client code. On the server the redaction list would catch a slip, and in the browser nothing will.
Best practices
Reserve error level for failures that reached the user
An alert is only worth having if it fires on something you would get up for. Use error when an operation failed in a way the user saw or a component is broken, and warn when the request completed through a degraded path: a cache write that failed, a user hitting a protected route, missing content that answered a 404.
Keep the message static and put the data in fields
A log aggregator groups by message, so interpolating a value into the string gives you one group per value and no way to count the problem.
Always pass the thrown value as err
err is the field name the transport serializes with the full stack, the cause chain, and any own properties the error carries. A plain JSON.stringify of an Error returns {}, so a different field name costs you the stack. Wrap a non-Error catch rather than passing it raw:
Add the fields you will search by
The message tells you what broke. The fields tell you which request it broke on. Add the identifiers you would filter by during an incident, and skip the ones already there: the namespace, the stack, and the trace ids are all added for you.
Log once, at the boundary closest to the customer
An error logged in a service and again in its controller doubles your error count and makes a dashboard useless for judging how often something actually fails. Pick one layer. Logging at the catch site before rethrowing is fine, as long as the caller that catches it does not log the same failure again.
Do not log per item in a loop
One line per product in a listing burns I/O and drowns the lines you need. Count or summarize instead.
Use the logger, not console
console.log bypasses the JSON shape your collector parses, the redaction list, and STOREFRONT_LOG_LEVEL, so it survives into production as a line you cannot filter and nothing masked. ESLint's no-console rule enforces this across src/, at error level outside test files.


