

OpenTelemetry
The Storefront Application V3 creates OpenTelemetry spans for every page request, Storefront API call, and render step without any code change. Where those spans go depends on the exporter you set: an OTLP collector, your console, or nowhere.
Why it matters
When a customer reports a slow checkout or an alert fires for a spike in errors, a trace tells you which request was slow, which Storefront API call took the time, and which page prop or render step caused it.
The same spans exist in development, so you can measure a slow page on your machine before you change anything. Spans also record request URLs, so the Storefront Application replaces credential values in them before they leave the process.
Try it
Try it: read a trace of your local storefront in Jaeger
Jaeger is a trace viewer that runs in a container next to your local Redis. You need Docker and a dev server that already starts locally, including its local TLS certificates.
- Start Redis and Jaeger with
docker compose --profile tracing up -d. - Add
OTEL_EXPORTER_OTLP_ENDPOINT='http://localhost:4318'andOTEL_METRICS_EXPORTER=noneto your.envfile. - Start the dev server with
pnpm dev. - Open a category page or a product page twice. The first request in development also compiles that route, so read the trace of the second one.
- Open
http://localhost:16686, select thestorefrontservice, and click Find Traces.
Jaeger lists one trace per request. Open one to see the span tree from the request span down to the Storefront API calls. Jaeger only accepts traces, so OTEL_METRICS_EXPORTER=none keeps the SDK from sending metric batches that Jaeger rejects.
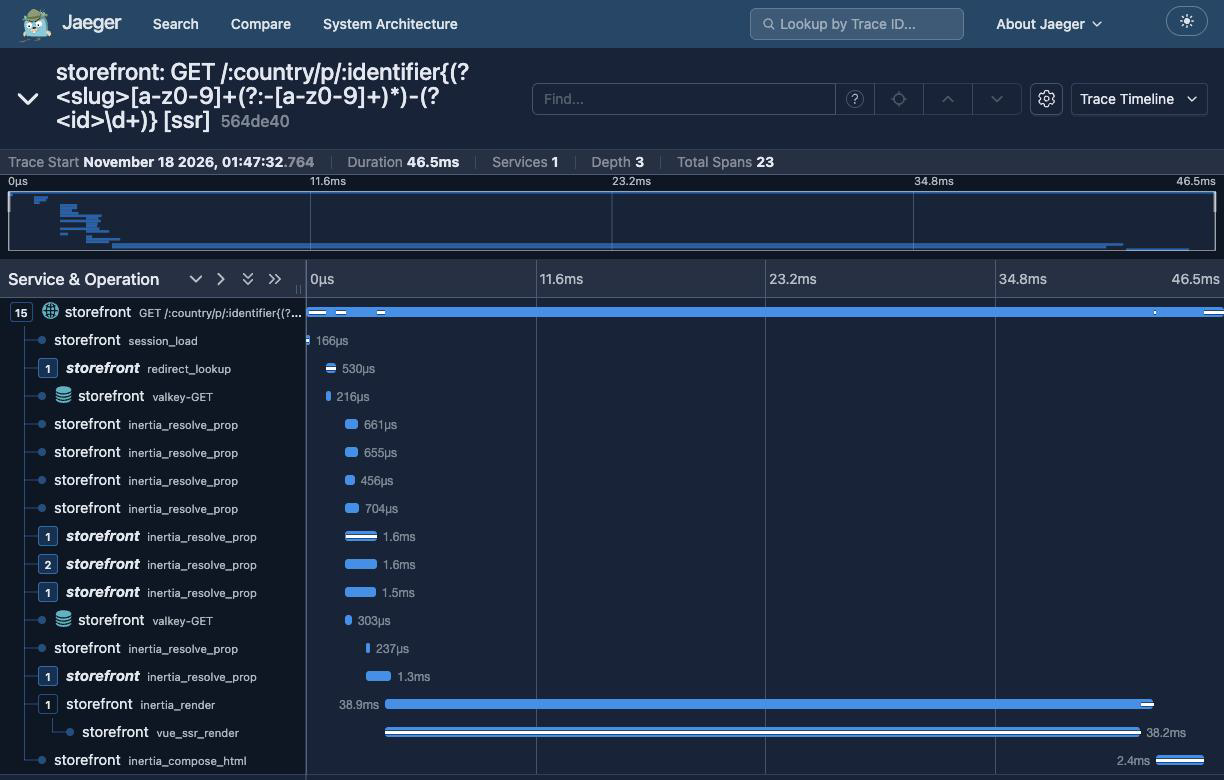
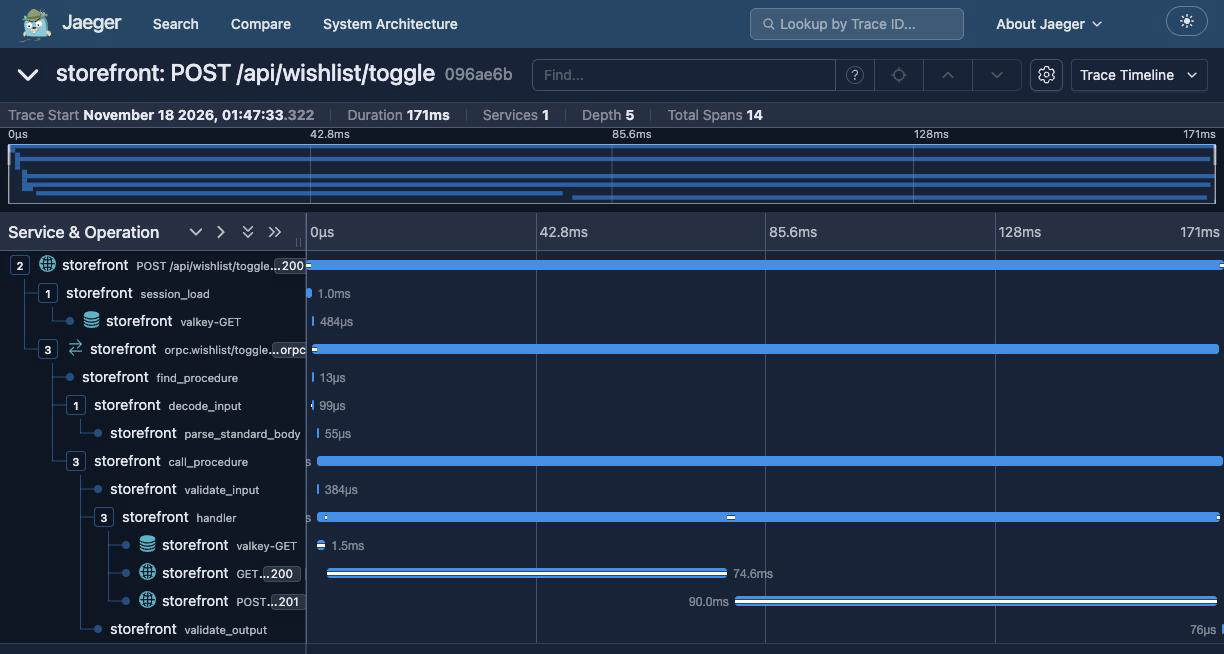
A mutation through the API router is its own trace. Adding an item to the wishlist, for example, produces a POST /api/wishlist/toggle trace with the oRPC spans under the request span.
What's included
- Request spans: an entry span from
@opentelemetry/instrumentation-httpand a route-named span from the Hono middleware insrc/server/index.ts. Both carry the matched route, so backends group requests by route. Inertia responses add a[ssr],[inertia], or[partial]suffix to the span name. - Storefront API calls: every outbound
fetchis a client span from the undici instrumentation, withhttp.request.body.size,http.response.body.size, and the response content encoding when the headers carry them. - Session, redirect, and Inertia spans:
@scayle/storefrontcreatessession_load,session_persist,redirect_lookup,inertia_resolve_prop,inertia_render, andinertia_compose_htmlitself. They are part of the runtime, not of the OpenTelemetry package. - Vue render span:
traceSsrRenderfrom@scayle/storefront-opentelemetry, which you call insrc/client/ssr.ts, createsvue_ssr_renderand records the rendered HTML size asvue.html_bytes. - oRPC spans: mutations through the API router, such as basket changes, get spans from
@orpc/otel. - SCAYLE KV spans: the storage driver
@scayle/unstorage-scayle-kv-drivercreates thevalkey-<COMMAND>spans for cache and session commands itself, because the Valkey GLIDE client cannot be patched by an instrumentation. These spans carry no query text. - DNS lookups: a span per lookup shows slow resolvers.
- Node.js runtime metrics: heap usage, event loop delay, and garbage collection activity.
- Query string redaction: credential values in
url.fullandurl.querybecomeREDACTEDon every exported span. - Log correlation: with the default JSON log format, a log line written inside an active span carries
trace_idandspan_id, so your platform links the line to its trace. - Flush on exit: the SDK flushes the last span batch and metric interval when the process exits.
What you can change
Configure
- Where traces and metrics go, which protocol they use, the service name, resource attributes, and sampling, all through environment variables. See Configuration.
- On Storefront Hosting, which provider receives your telemetry, the service name, and one environment name per environment, all in the SCAYLE Panel. See Setup.
Extend
- Filter more paths out of your traces with
filterPathon the Vite plugin andpathBlockliston the Hono middleware. - Keep an extra query value out of your traces with
additionalRedactedQueryParams. - Capture your own request headers with
requestHeadersandresponseHeaderson the Hono middleware.pathReplace,ignoreRequestHook, andresolveClientAddressare the other middleware options. - Limit which modules the instrumentation hooks patch with
includeandexcludeon the Vite plugin. - Remove the Vue render span by editing
src/client/ssr.ts.
Replace
- Add instrumentations for your own dependencies, such as the AWS SDK. The hook is
additionalInstrumentationsoninitSDK, butopentelemetryPlugindoes not forward it. Taking it over means replacing the startup that the plugin generates with your own code that registers the hooks, callsinitSDK, and then loads the application.
Constraints and limits
Permanent
- Tracing is server-side only. The browser produces no spans.
OTEL_LOGS_EXPORTERhas no effect. The SDK prints log records through the Storefront Application's logger and never sends them over OTLP, so log output reaches your console without a collector. The Storefront Application and its SDK packages emit no OpenTelemetry log records. Only instrumentations you add, or code you write, produce them.- With
OTEL_TRACES_EXPORTER=none, the SDK registers no tracer provider, so no trace exists to read. Metrics and the logger bridge keep running.
Known limitations
- The Hono middleware sits after static asset serving in
src/server/index.ts, so an asset request gets no Hono span. In a production build, the entry span from the HTTP instrumentation still exists for it. Match the asset paths infilterPathto drop that span too. - A call to
initSDKinvite.config.tsruns when the build evaluates the config, not in the server process that the generated entry starts. filterPathruns for incoming requests and for outgoing Storefront API calls. For an incoming request it receives the URL with its query string, sopath === '/api/up'does not match/api/up?x=1. UsestartsWithor a regular expression. A filter such aspath.startsWith('/static')also drops outgoing calls whose request path starts the same way.filterPathremoves the entry span andpathBlocklistremoves the Hono span, so hiding a path completely takes both. The health probe/api/upis registered before the middleware, so onlyfilterPathhas an effect on it.- Redaction covers
url.fullandurl.queryonly. A header you capture, such asrefererthroughrequestHeaders, reaches the span unchanged. - In development, the HTTP instrumentation can miss requests, because Node's built-in modules may load before the dev server starts the SDK. The Hono span still appears.
How it works
A Vite plugin starts the SDK through initSDK, which registers a fixed set of instrumentations and the exporters you choose. Development and production start it differently.
In production, the build replaces the application's entry module with a generated one. It registers the instrumentation hooks, calls initSDK, and only then loads your application, so the first request is already traced. Nothing in that entry catches a failed start. A wrong OTEL_EXPORTER_OTLP_ENDPOINT does not stop requests, but it leaves you without traces until you fix it.
In development, the plugin starts the SDK when the Vite dev server starts. If the SDK itself fails to start, the dev server logs a warning and keeps running without tracing.
The span tree
A full page load produces the tree below. The entry span comes from the HTTP instrumentation. The Hono middleware creates the request span under it and gives both spans the same route name.
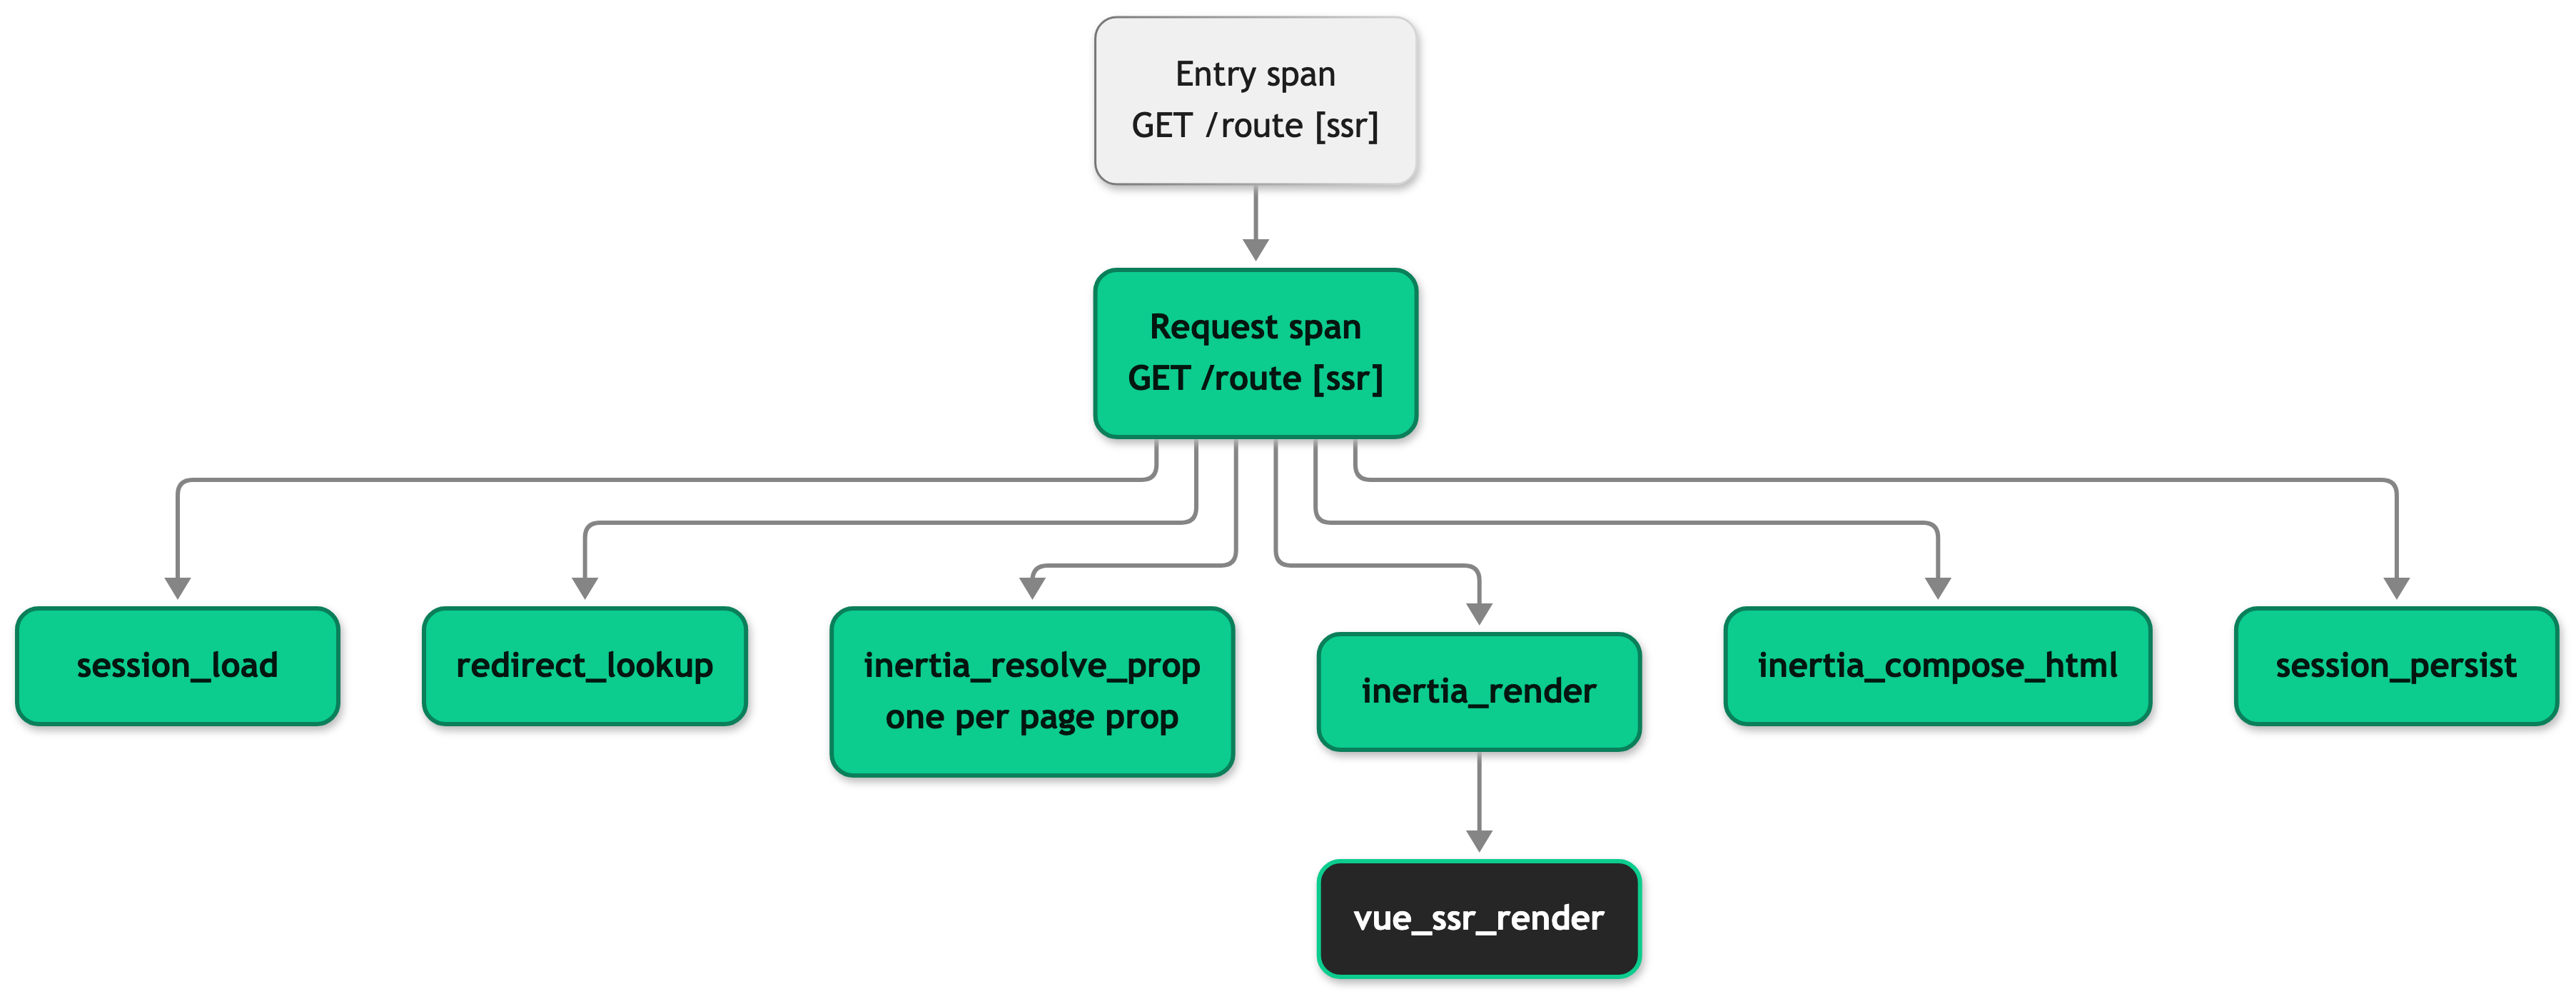
inertia_compose_html is a sibling of inertia_render, not a child. It runs after the render returns and covers the HTML template and the splice of head and body into it. Outgoing Storefront API calls, SCAYLE KV spans, and DNS lookups that a page prop triggers sit under that prop's inertia_resolve_prop span, so a slow call points at its prop. Calls made by the session store and the redirect lookup sit under session_load, session_persist and redirect_lookup instead. Props resolve in parallel, so their durations overlap. Read the parent span for elapsed time and the prop spans to see which one to fix.
Not every request produces every span:
session_loadappears on every request that resolved a shop.session_persistappears only when the request saved the session or extended the expiry of a stored one.redirect_lookupappears onGETandHEADfull page loads and Inertia visits that resolved a shop, not on partial reloads. When it finds a redirect, the page never renders, so the render spans are missing.- An Inertia visit or partial reload returns the page as JSON. It has no
inertia_render,vue_ssr_render, orinertia_compose_htmlspan. - The suffix in the span name tells the request types apart.
[ssr]is a full page load,[inertia]is a client-side visit, and[partial]is a partial reload.http.routealways holds the plain route pattern. Routes that answer without Inertia, such as oRPC endpoints, have no suffix.
The entry span ends after the response body is written, so it also covers response compression and the socket write. The request span ends when the handler chain returns, before compression. Time in the entry span after its request span ended is that compression and write.
The route name is the Hono route pattern, such as a route with :identifier. When the matched pattern ends in /*, the span uses the real request path instead. A catch-all route then creates one span name per URL, which pathReplace can normalize.
Exporters and redaction
initSDK resolves OTEL_TRACES_EXPORTER itself: otlp is the default, console prints each span, and none turns trace export off. The OTLP exporter speaks http/protobuf unless OTEL_EXPORTER_OTLP_PROTOCOL says http/json or grpc. Metric exporters and propagators are left to the SDK, which reads OTEL_METRICS_EXPORTER and OTEL_PROPAGATORS.
A span processor sits in front of every trace exporter. It rewrites the span URLs when the span ends, so exporters only see redacted values.
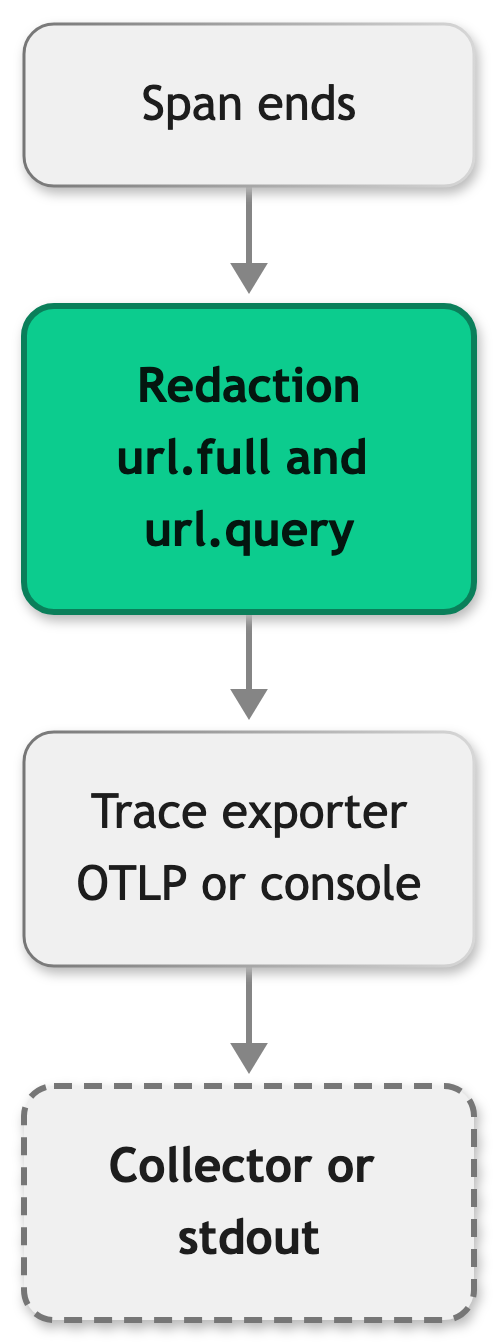
The redacted keys are the list that @scayle/storefront exports as SENSITIVE_QUERY_PARAMS from @scayle/storefront/shared. It covers, for example, the password reset hash, the order success token cbd, the OAuth code, state, and access_token, the Storyblok token and _storyblok_tk, and the Contentstack live_preview, plus the credential names the logger masks. Keys match case-insensitively and a key also covers its bracketed sub-keys. Credentials in the URL authority, as in https://user:password@host/, become REDACTED:REDACTED@host. You add keys but you cannot remove the defaults.
Setup
How you export telemetry depends on where you host the Storefront Application V3.
Storefront Hosting
Storefront Hosting is the managed path. Its Monitoring Exporter forwards your storefront's logs, metrics, and traces to your monitoring provider, and you set it up once per shop in the SCAYLE Panel. The Monitoring Exporter page owns the supported providers, the permissions, the setup steps, and the telemetry settings for the service name, the sampling rates, and one environment name per environment. Check them there first when a trace is missing or labeled unexpectedly.
Self-hosted
Outside Storefront Hosting you run the OTLP collector, so the standard OpenTelemetry environment variables apply directly. A missing or unreachable endpoint does not fail your build or stop requests, so check the setup before you depend on traces.
You need a collector that your production network can reach and, if it requires them, its credentials.
- Set
OTEL_EXPORTER_OTLP_ENDPOINTto your collector. The default ishttp://localhost:4318, which only works on your own machine. - Set
OTEL_EXPORTER_OTLP_HEADERSif the collector needs an API key. - Set
OTEL_SERVICE_NAMEto a name that is unambiguous in a shared platform, such asmy-storefront-prod. - Set
OTEL_RESOURCE_ATTRIBUTESto label the environment, for exampledeployment.environment=production. - Leave
OTEL_TRACES_EXPORTERandOTEL_METRICS_EXPORTERunset, so both useotlp. Theconsoleexporter prints every span to stdout. - Deploy and request a page.
Your platform now lists a trace under the service name you chose, and the trace has no /api/up health probe spans because defaultPathFilter drops them.
Configuration
Environment variables
The SDK reads the standard OpenTelemetry variables at startup. See the OpenTelemetry environment variable specification for the full set.
| Variable | Purpose | Default | Change needs |
|---|---|---|---|
OTEL_SERVICE_NAME | Service name in your platform. | unknown_service:node when unset. .env.example sets storefront. | Restart |
OTEL_EXPORTER_OTLP_ENDPOINT | OTLP collector endpoint. | http://localhost:4318 | Restart |
OTEL_EXPORTER_OTLP_PROTOCOL | Trace protocol. Accepts http/protobuf, http/json, and grpc. OTEL_EXPORTER_OTLP_TRACES_PROTOCOL overrides it for traces. | http/protobuf | Restart |
OTEL_EXPORTER_OTLP_HEADERS | Headers for OTLP requests, such as an API key. | Unset | Restart |
OTEL_RESOURCE_ATTRIBUTES | Extra resource attributes as comma-separated key=value pairs. | Unset | Restart |
OTEL_TRACES_EXPORTER | Trace exporter: otlp, console, or none. | otlp | Restart |
OTEL_METRICS_EXPORTER | Metric exporter: otlp, console, or none. | otlp | Restart |
OTEL_BSP_MAX_QUEUE_SIZE, OTEL_BSP_SCHEDULE_DELAY, OTEL_BSP_EXPORT_TIMEOUT, OTEL_BSP_MAX_EXPORT_BATCH_SIZE | Batch limits of the otlp trace exporter. A zero or negative value logs a warning and keeps the default. | The SDK defaults | Restart |
OTEL_TRACES_SAMPLER and OTEL_TRACES_SAMPLER_ARG | Sampling, as the specification describes. | SDK default | Restart |
OTEL_PROPAGATORS | Trace context formats: tracecontext and baggage, b3, b3multi, or none. A list with no supported value, such as jaeger alone, registers no propagator, so traces do not continue across services. | tracecontext,baggage | Restart |
OTEL_LOG_LEVEL | Set to debug to print the SDK's own diagnostic warnings, such as a bad exporter value. Without it you see none. | Unset | Restart |
UNSTORAGE_COMPRESSION_OTEL_TRACE | Set to true to wrap cache compression and decompression in spans. It adds overhead per operation, and a restart applies a change. | false | Restart |
Vite plugin options
You register the plugin in vite.config.ts. The Storefront Application V3 passes only filterPath.
| Option | Type | Description |
|---|---|---|
filterPath | (path: string) => boolean | Returns true for paths the HTTP and undici instrumentations skip. Must be self-contained. The Storefront Application V3 passes defaultPathFilter, which matches /api/up. |
additionalRedactedQueryParams | string[] | Query keys to redact on top of the defaults. |
include | (string | RegExp)[] | Allowlist of module specifiers the instrumentation hooks patch. Unset instruments everything. |
exclude | (string | RegExp)[] | Module specifiers the hooks leave alone. Matched exactly, like include. |
Hono middleware options
The middleware in src/server/index.ts spreads defaultOpenTelemetryConfig and adds resolveClientAddress. The defaults capture the request headers x-shop-country-id, content-type, and the X-Inertia header set, the response header content-type, and a pathBlocklist of ^/api/up$.
| Option | Type | Description |
|---|---|---|
pathBlocklist | string | Regular expression for paths that get no Hono span. A string that is not a valid expression is matched as a substring. |
pathReplace | [string, string] | Pattern and replacement that normalize the route name, for example ['^/(en|de|fr)/', '/:locale/']. |
requestHeaders | string[] | Request headers recorded as http.request.header.<name>. |
responseHeaders | string[] | Response headers recorded as http.response.header.<name>. |
ignoreRequestHook | (c: Context) => boolean | Returns true to skip the span for a request. |
resolveClientAddress | (headers) => string | undefined | Resolves the client IP address for client.address. The attribute is omitted when it returns undefined or throws. |
Customization guides
Keep an extra query value out of your traces
Your checkout flow or an integration can put a credential in a query string, such as a payment provider token. The SDK redacts the default keys, and you add yours so they never reach your platform.
- Open
vite.config.ts. - Add
additionalRedactedQueryParamsto theopentelemetryPlugincall. - Restart the dev server or rebuild.
Request a URL that carries ?payment_token=abc. The url.query attribute on the span reads payment_token=REDACTED. If a header carries the same URL, remove it from requestHeaders, because redaction does not cover headers.
Filter more paths out of your traces
A monitoring probe or a noisy path can flood your platform with traces nobody reads. Filtering removes the spans at both layers.
- In
vite.config.ts, replacedefaultPathFilterwith a self-contained function that still matches the health probe. - In
src/server/index.ts, extendpathBlocklistwith the same paths. - Restart the dev server or rebuild.
Requests to the path in the filter, /api/ready in this example, no longer produce an entry span or a Hono span. Replace it with the path of your own health probe. The snippet keeps resolveClientAddress from the Storefront Application V3 so you do not lose client.address.
Capture your own request headers
A header such as a request ID helps you find the trace for a customer report. Add it to the list that defaultOpenTelemetryConfig provides, so the defaults stay.
Requests that carry x-request-id now have http.request.header.x-request-id on the Hono span. A header that carries a URL or a credential reaches the span as it is.
Remove the Vue render span
If you do not want Vue render time as its own row, remove the traceSsrRender call. Keep the withModulePreloads call. It collects the components the render drew for the modulepreload hints, and dropping it costs every page those hints without any error.
Also remove the unused traceSsrRender import. The vue_ssr_render span no longer appears under inertia_render, and inertia_render then covers the render on its own.
Best practices
Check payload sizes on Storefront API calls
Large responses show up as large http.response.body.size values on the outgoing call spans. Broad with includes on listing requests are a common cause. The attribute is set only when the upstream sends a content-length header, and a chunked response has none.
Check that a span exists in the terminal
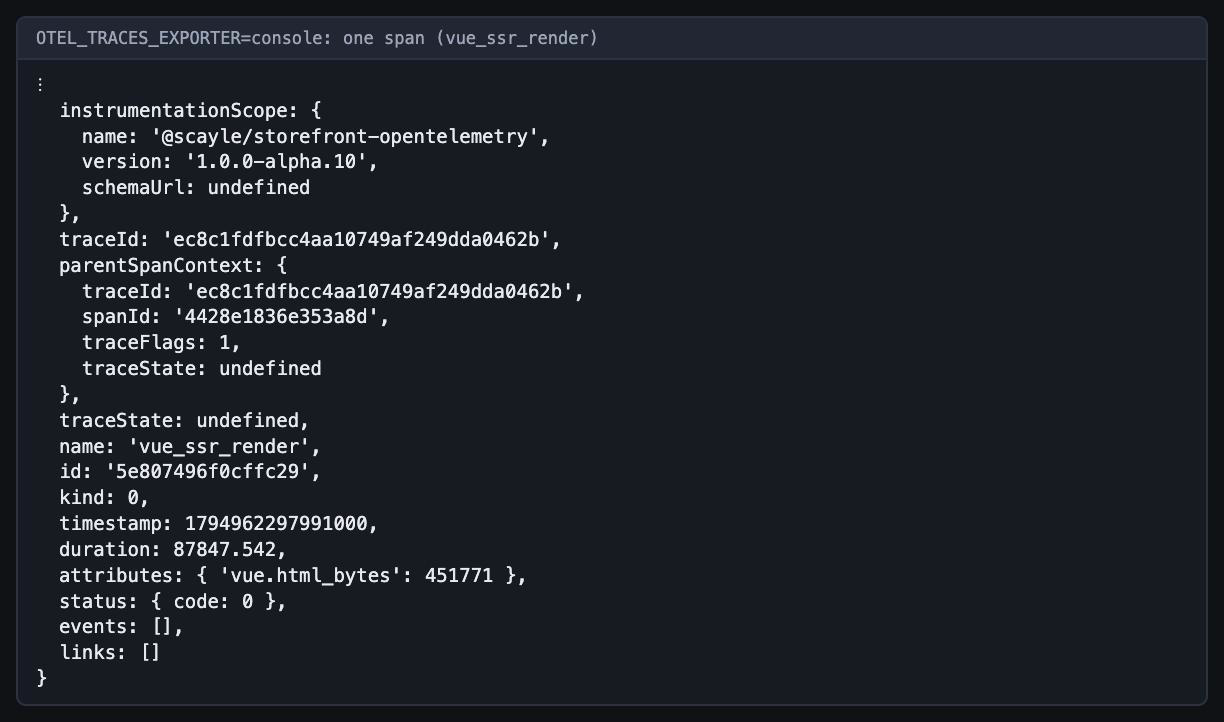
To check that a span exists without running a trace viewer, print spans to the terminal instead. A single page render prints a long list of span objects in no particular order, so use this for existence checks and not for timing.
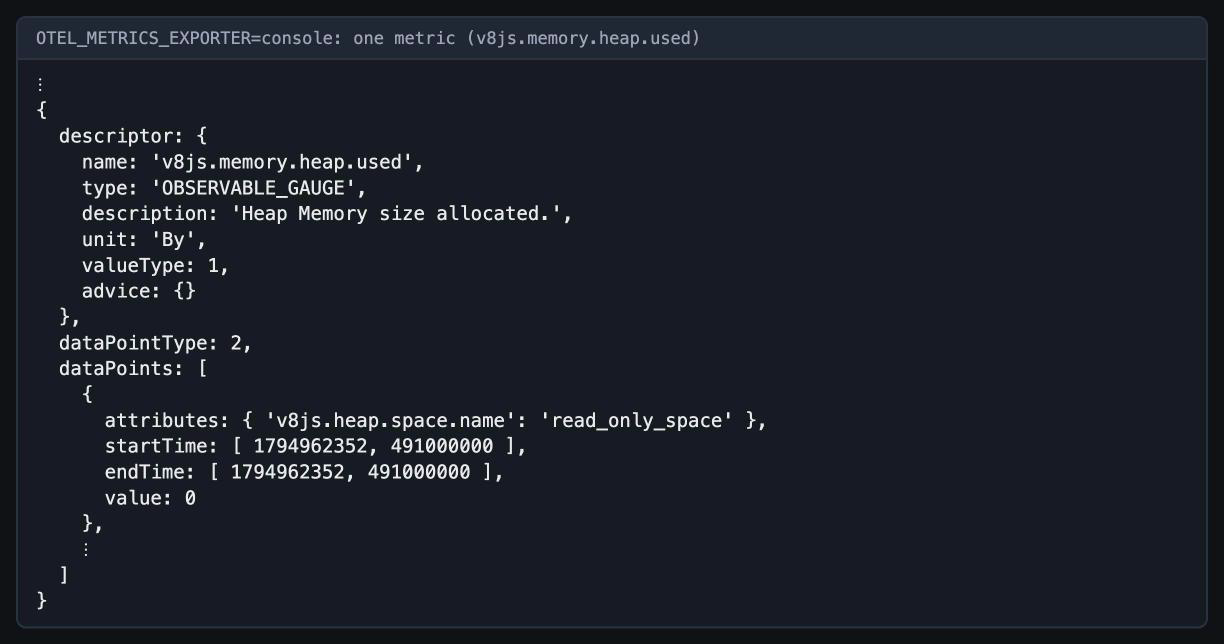
Metrics print on the metric reader's interval, which is about 60 seconds by default, so they appear later than spans.
The console exporters print JavaScript object literals, not strict JSON. Each span object starts with a resource block that lists your machine and process, so look at the output before you paste it anywhere. The screenshots show one span and one metric without that block.
Troubleshooting
I see no traces in my observability platform
Issue: Requests work, but your platform shows no traces for the service.
Possible causes: The collector is unreachable from where the storefront runs, or OTEL_EXPORTER_OTLP_ENDPOINT is unset and the SDK sends to localhost:4318. OTEL_TRACES_EXPORTER is none or holds a value the SDK skips. The collector rejects the batches, for example Jaeger answering 404 for metrics. At the default diagnostic level the SDK prints none of these problems.
Solution:
- Set
OTEL_LOG_LEVEL=debugand restart. The SDK now prints warnings for a bad exporter value or protocol. - Set
OTEL_TRACES_EXPORTER=consoletemporarily. If spans print, the SDK works and the problem is the endpoint or credentials. - Check the endpoint, the protocol, and
OTEL_EXPORTER_OTLP_HEADERSagainst your collector. - Check that your production network can reach the collector.
- On Storefront Hosting, check the setup and the sampling rates on the Monitoring Exporter page.
Prevention: Make collector reachability part of your deployment checklist, not something you check during an incident.
A span from the tree is missing
Issue: You expected a span in a trace and it is not there.
Possible causes: The request type has no such span. The span tree lists which requests produce which span. filterPath or pathBlocklist matched the path. The span belongs to a library you did not add an instrumentation for.
Solution:
- Read the suffix in the span name.
[partial]and[inertia]requests skip the render spans. - Check whether the response was a redirect.
- Check
filterPathandpathBlocklistagainst the path. - If the span comes from your own dependency, add its instrumentation. See Replace under What you can change.
Prevention: Compare a few traces of each request type after you change filters.
The service shows up as unknown_service:node
Issue: Your platform lists the storefront under unknown_service:node.
Possible causes: OTEL_SERVICE_NAME is not set in the environment of the running process.
Solution:
- Set
OTEL_SERVICE_NAMEin the environment of the process..env.exampleshipsstorefrontfor local development. - Restart the server.
Prevention: Set the service name in your production environment variables when you set the endpoint.


