

Storefront DevTools
How do you see what a page of the Storefront Application V3 fetched, rendered, and sent while you build it? @scayle/storefront-devtools adds a dock to your dev server. Its panels list the Inertia.js visits and the oRPC calls to /api that your browser made, and the shop, country, and locale a page resolved. Vue DevTools, Vite Inspect, and an Open Graph viewer sit in the same dock. The Storefront Application V3 already includes the package, it runs on the dev server only, and it is published as a pre-release.
The Network tab stays the better tool for one raw request. The panels cover what it cannot show:
- Many Inertia.js visits never reach the network. The first page load arrives inside the HTML, and client-side history navigations and prefetch cache hits send no request.
- The Network tab shows one request at a time. The Inertia.js panel compares visits and nests a deferred-prop reload under the visit that triggered it.
- An oRPC request body is not the argument your code passed. The oRPC panel decodes it back to the value your client sent.
Open the dock
You open the dock from the page you are working on. The dock starts with the dev server and needs no setup. It needs the Storefront Application V3 running locally over HTTPS, as described in Set Up Your Storefront.
- Run
pnpm dev. - Open the storefront in your browser, for example
https://localhost:3000. - Open the launcher at the bottom of the page.
- The first time a browser connects, the dock asks for a one-time code. Enter the code the
pnpm devterminal prints, or open the link printed next to it. The terminal also prints when the code expires. - Pick an entry. The SCAYLE Storefront group holds the Storefront, oRPC, and Inertia.js tabs. Vue DevTools, Inspect, and Open Graph are separate entries.
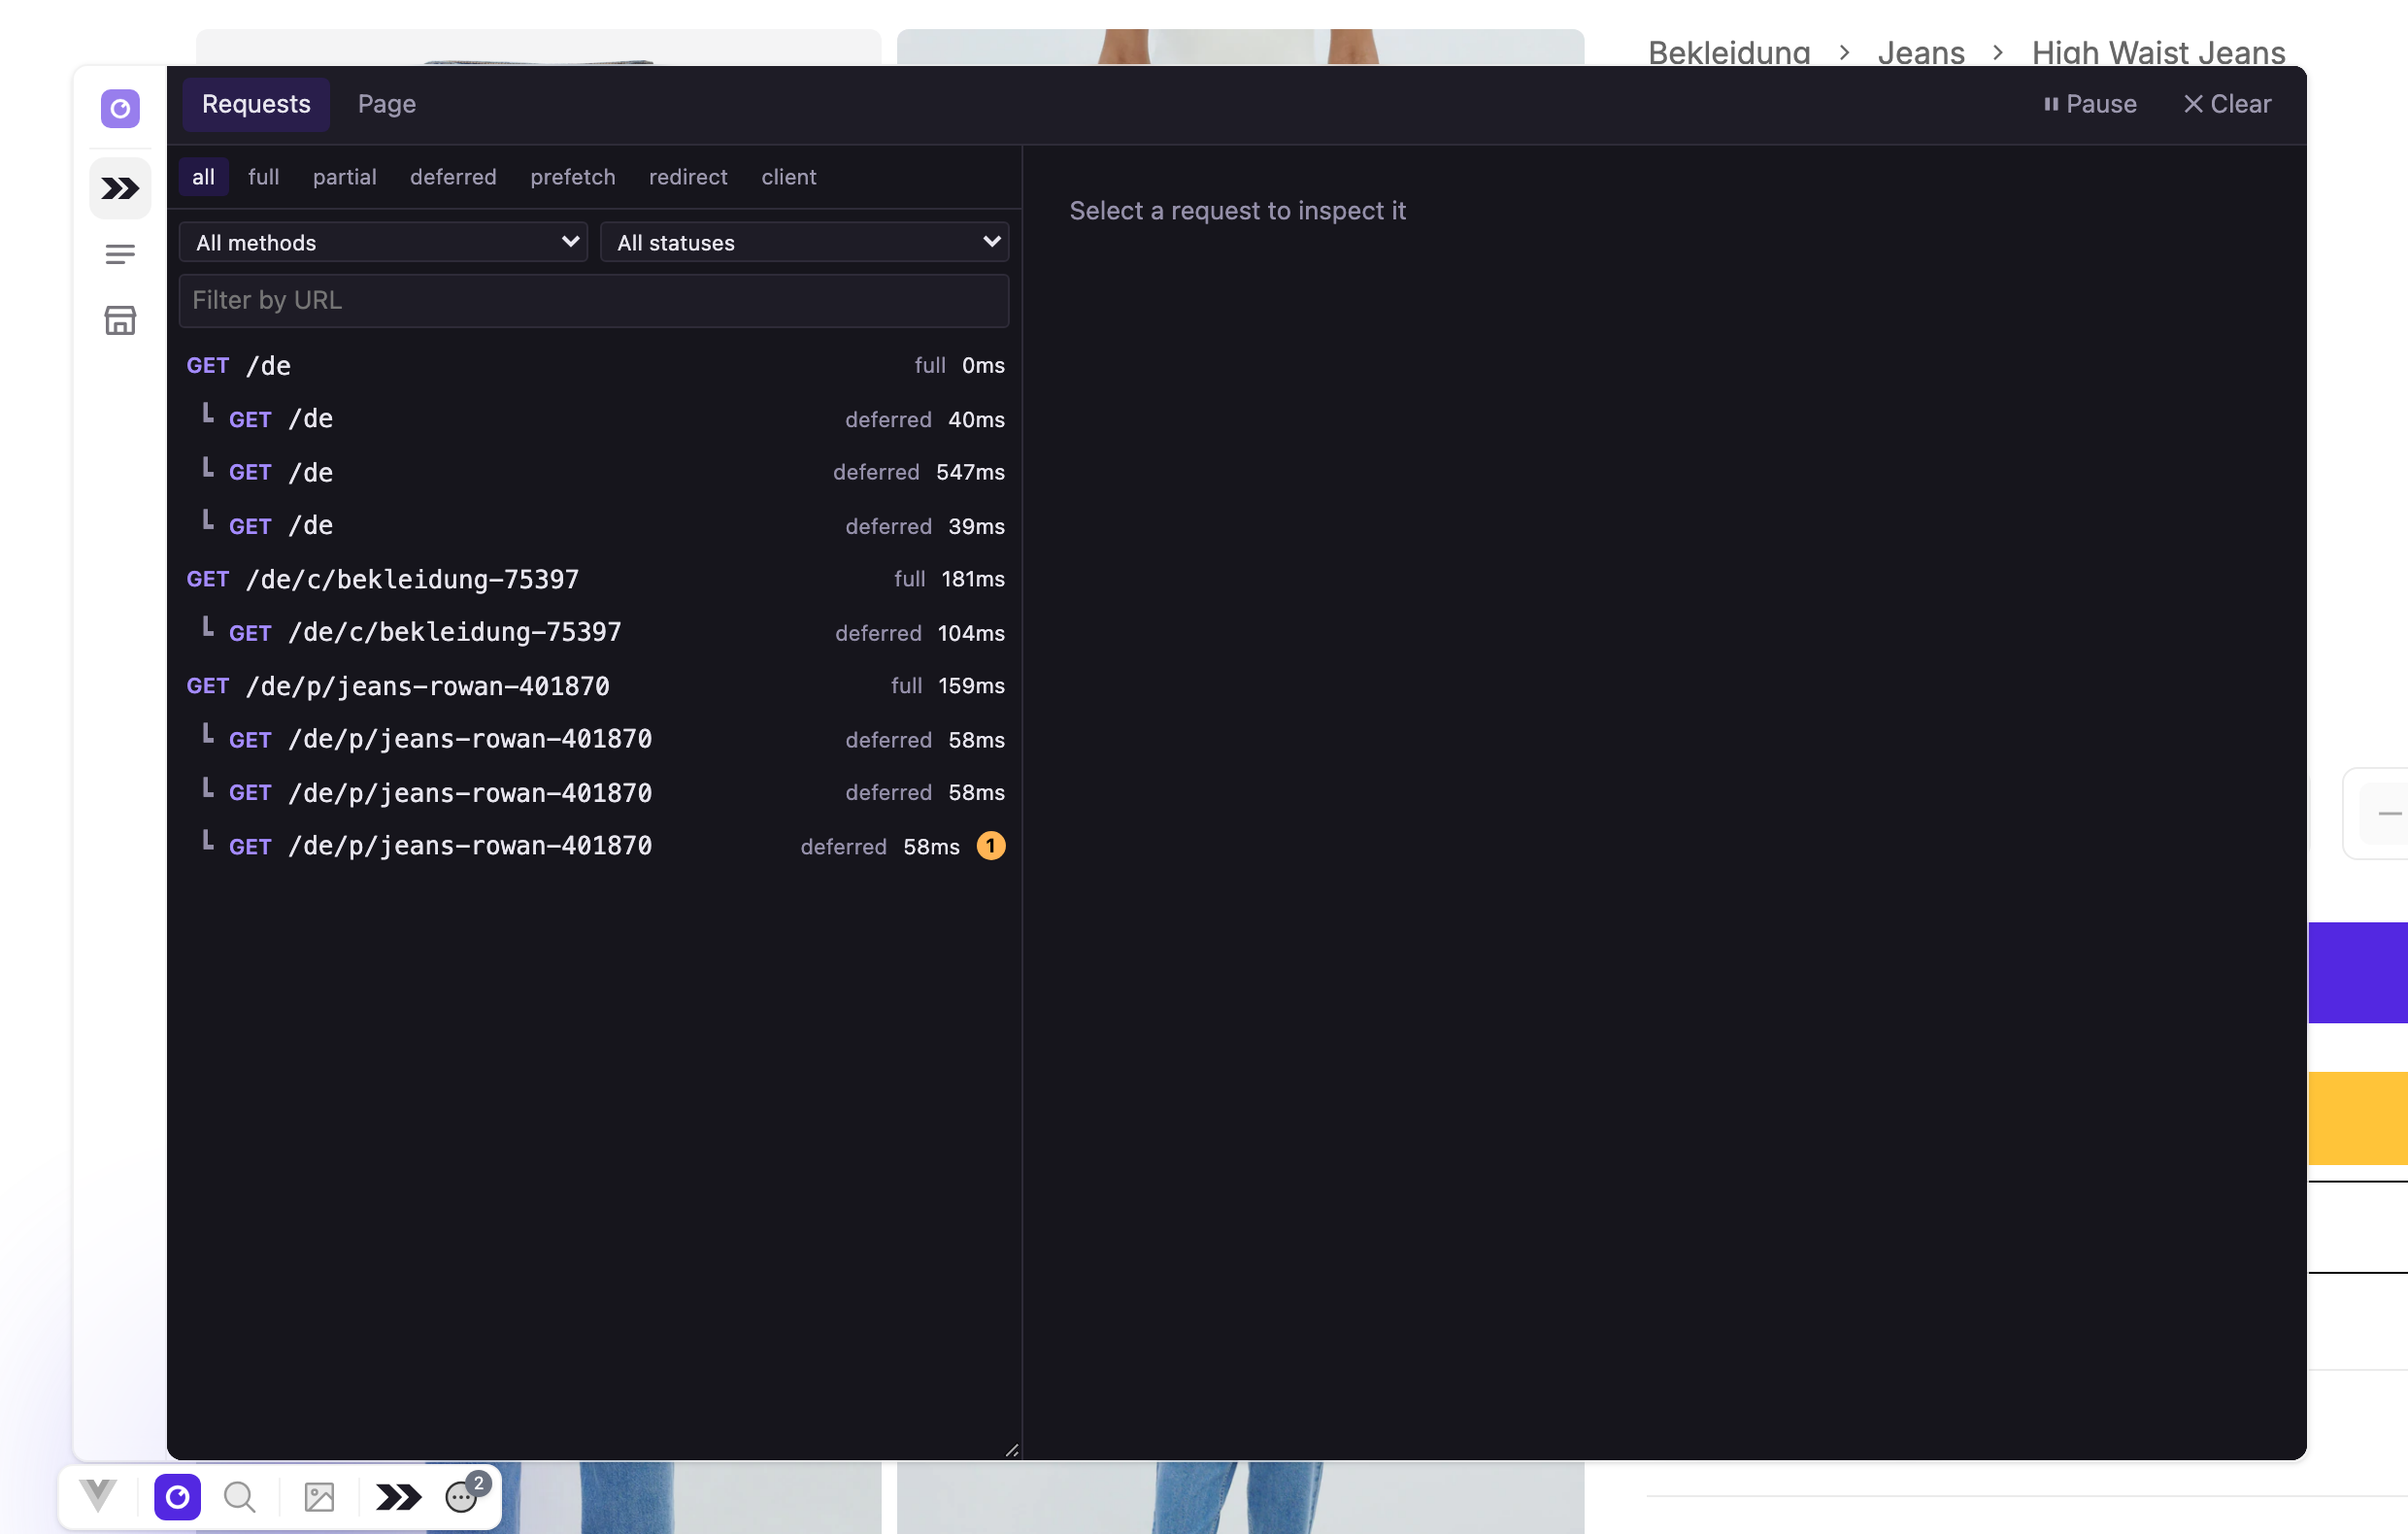
Each entry opens its panel. The Inertia.js list fills as you navigate the storefront.
If you open the storefront on a hostname that is not a loopback address, such as one from /etc/hosts, a reverse proxy, or a tunnel, the dock refuses to connect until you allow that origin. See Configuration.
What's included
- Inertia.js panel: Every visit with its props, headers, protocol details, lifecycle timeline, and diagnostics for common mistakes.
- oRPC panel: Every call your browser sends to
/api, with decoded input and output, failures sorted by kind, and timing per procedure. - Storefront context panel: The shop, country, locale, and currency the current page resolved.
- Messages dock: The messages the dock received, such as the Inertia.js diagnostics that also show as toasts. Its button appears with the first message.
- Vue DevTools: The component tree, the timeline, and the inspectors that Vue plugins such as vue-i18n register.
- Vite Inspect: Every module Vite loaded and what each plugin did to it, for the client and the server render.
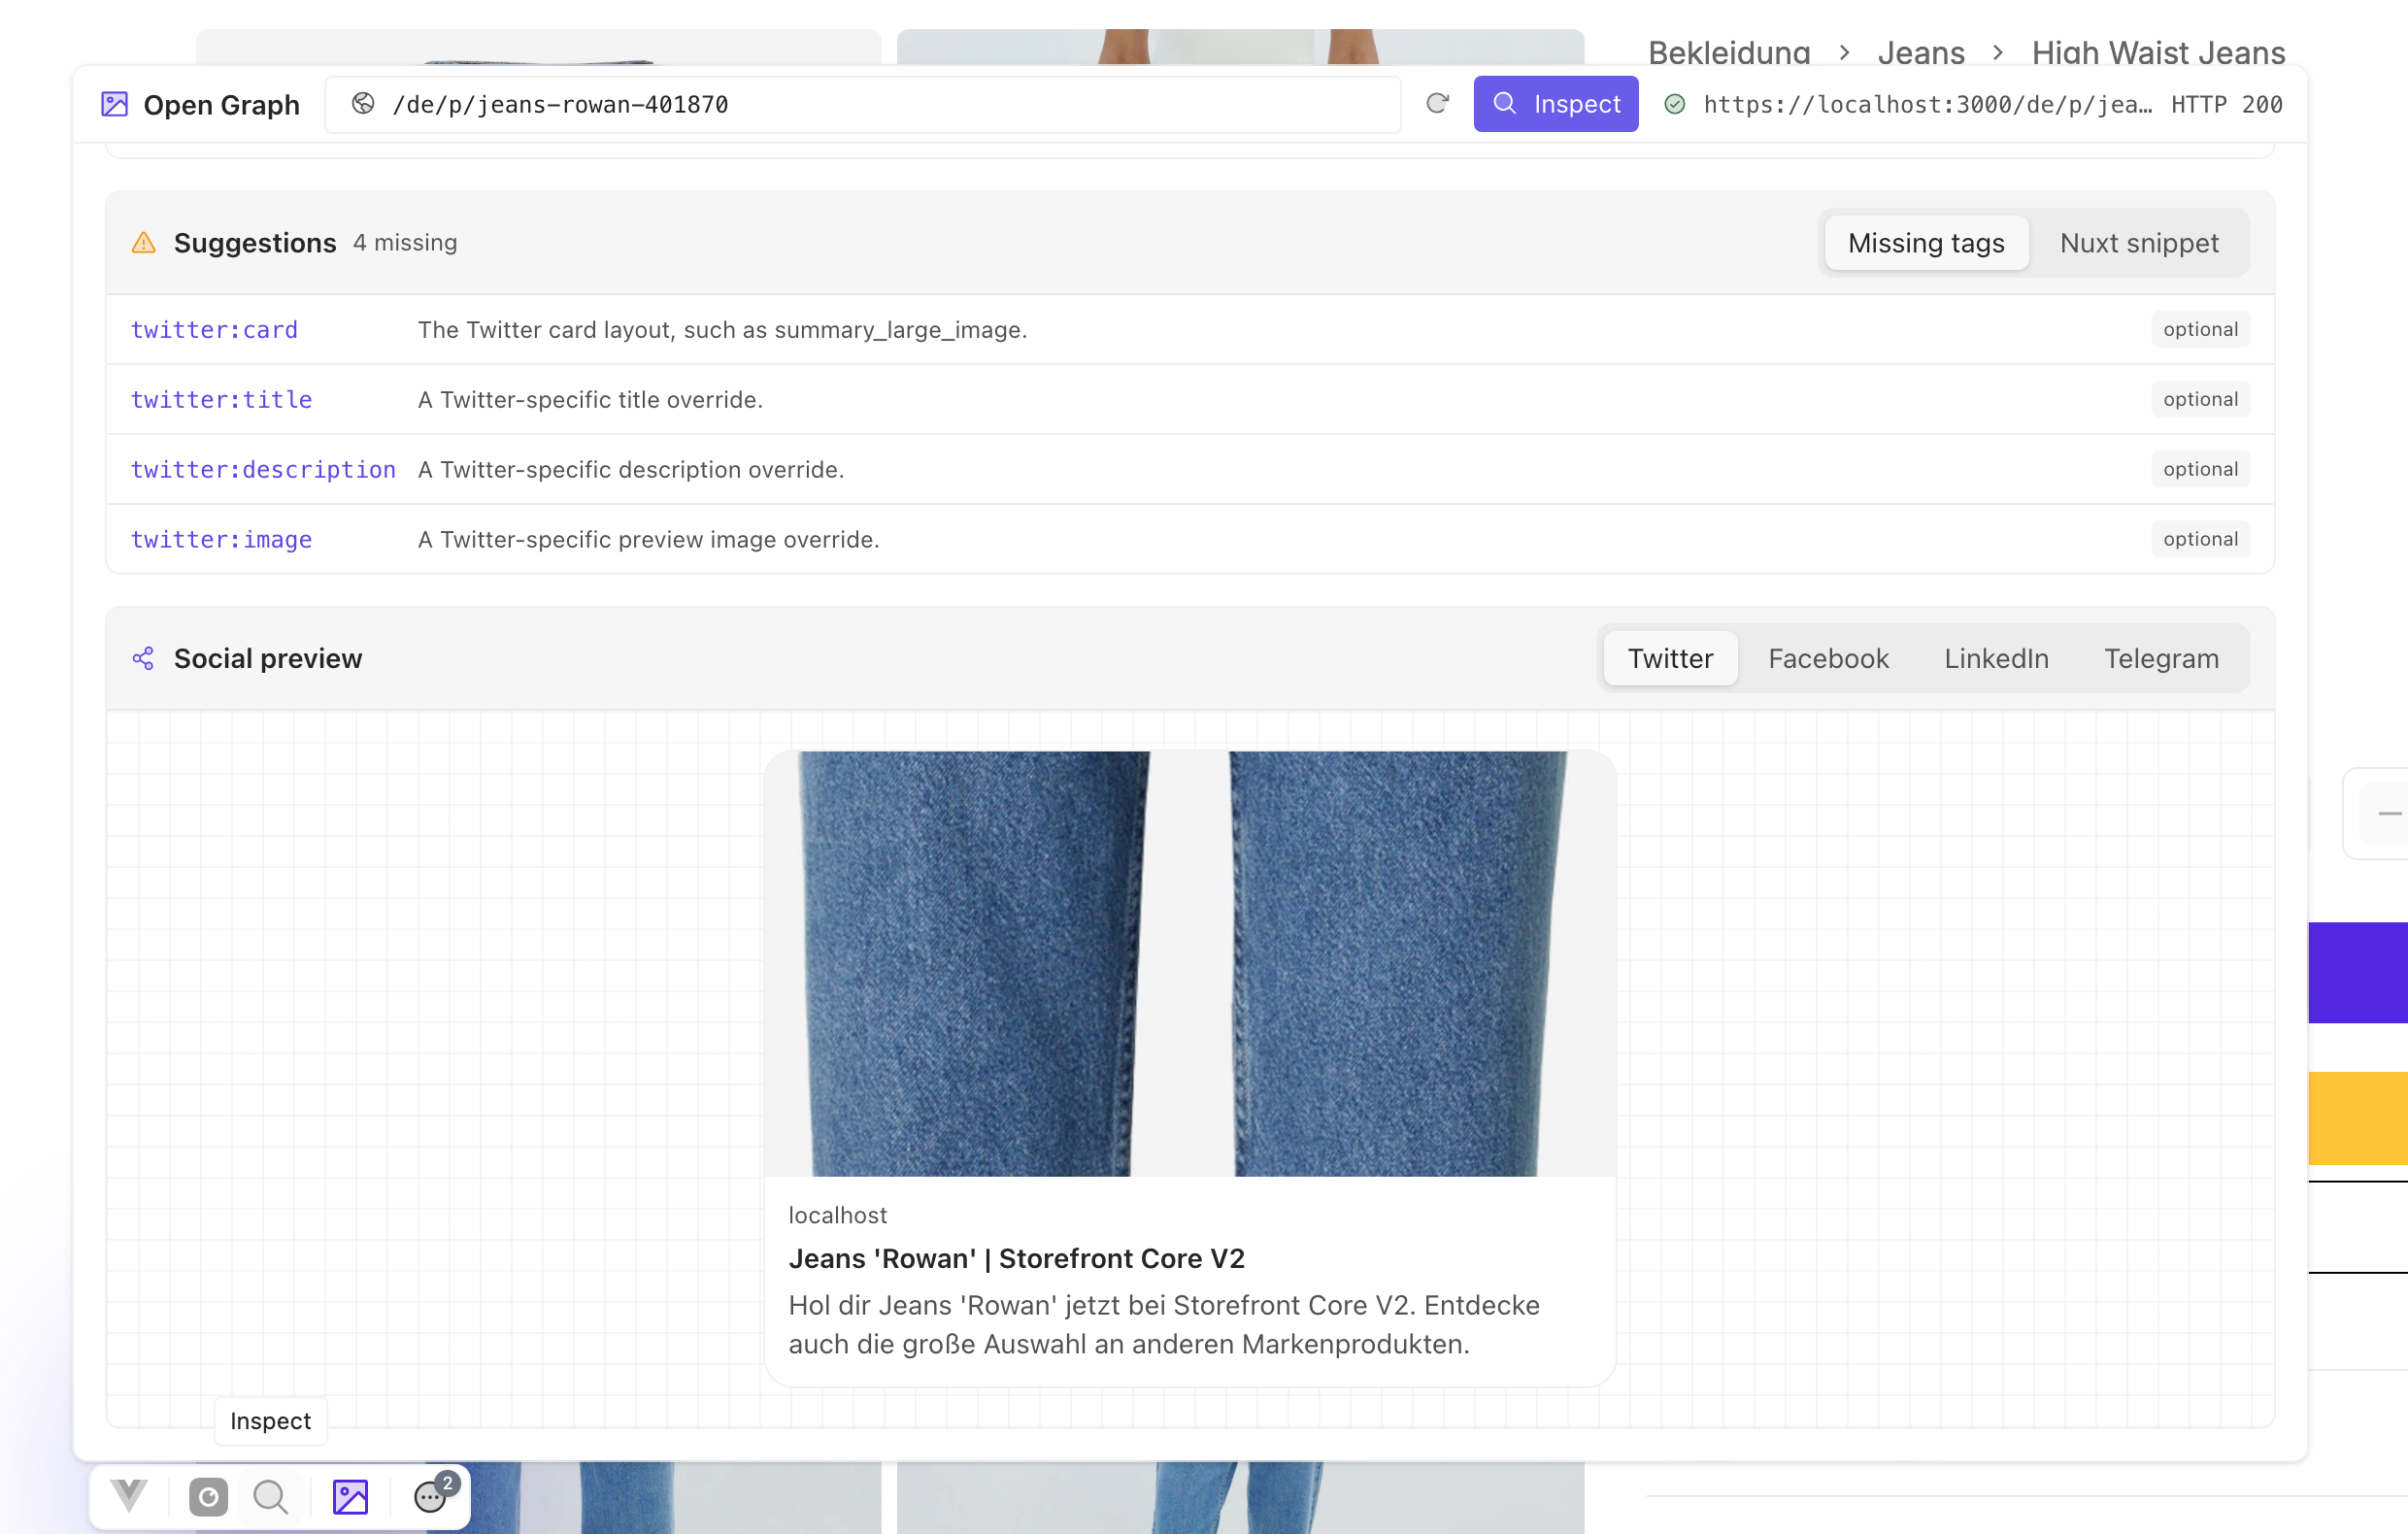
- Open Graph viewer: The meta tags of the current page and a preview of how a shared link looks.
What each panel answers
Inertia.js panel
The panel answers what a visit sent and received. It has a Requests tab and a Page tab. The Requests tab lists each visit with its method, URL, visit type, and duration. Filter by type (full, partial, deferred, prefetch, redirect, or client), by method (GET, POST, PUT, PATCH, or DELETE), or by status range (2xx, 4xx, or 5xx), or type into the URL box. A client visit has the method PUSH or REPLACE and no response status, so a method or status filter hides it. The first page load has no response status either, so a status filter hides it too. Select a visit to see four tabs:
- Response lists the response props and how each arrived: full, partial, deferred, merged, prepended, or deep-merged. It names the props you requested with
onlythat the response left out. Show changes since last page marks added, removed, and changed values. - Headers shows the request and response headers.
- Network shows the protocol side: visit type, asset version, the
onlyandexceptkeys, the error bag, and the reset keys. - Events shows the lifecycle (
before,start,success,finish, and the rest) as a timeline, with every captured event below it.
The Page tab shows the props of the page you are on right now, apart from any single visit. The header of a visit has Copy as Markdown, which copies the visit with its features, its error, the page JSON, and the headers, ready for an issue or an AI chat. Pause stops capture while you read a visit, and Clear empties the list. The panel keeps the active top-level tab (Requests or Page), the filters, the list width, and the rows you opened in the Response and Page tabs in sessionStorage, so they survive a reload of the same browser tab. It does not keep the URL box.
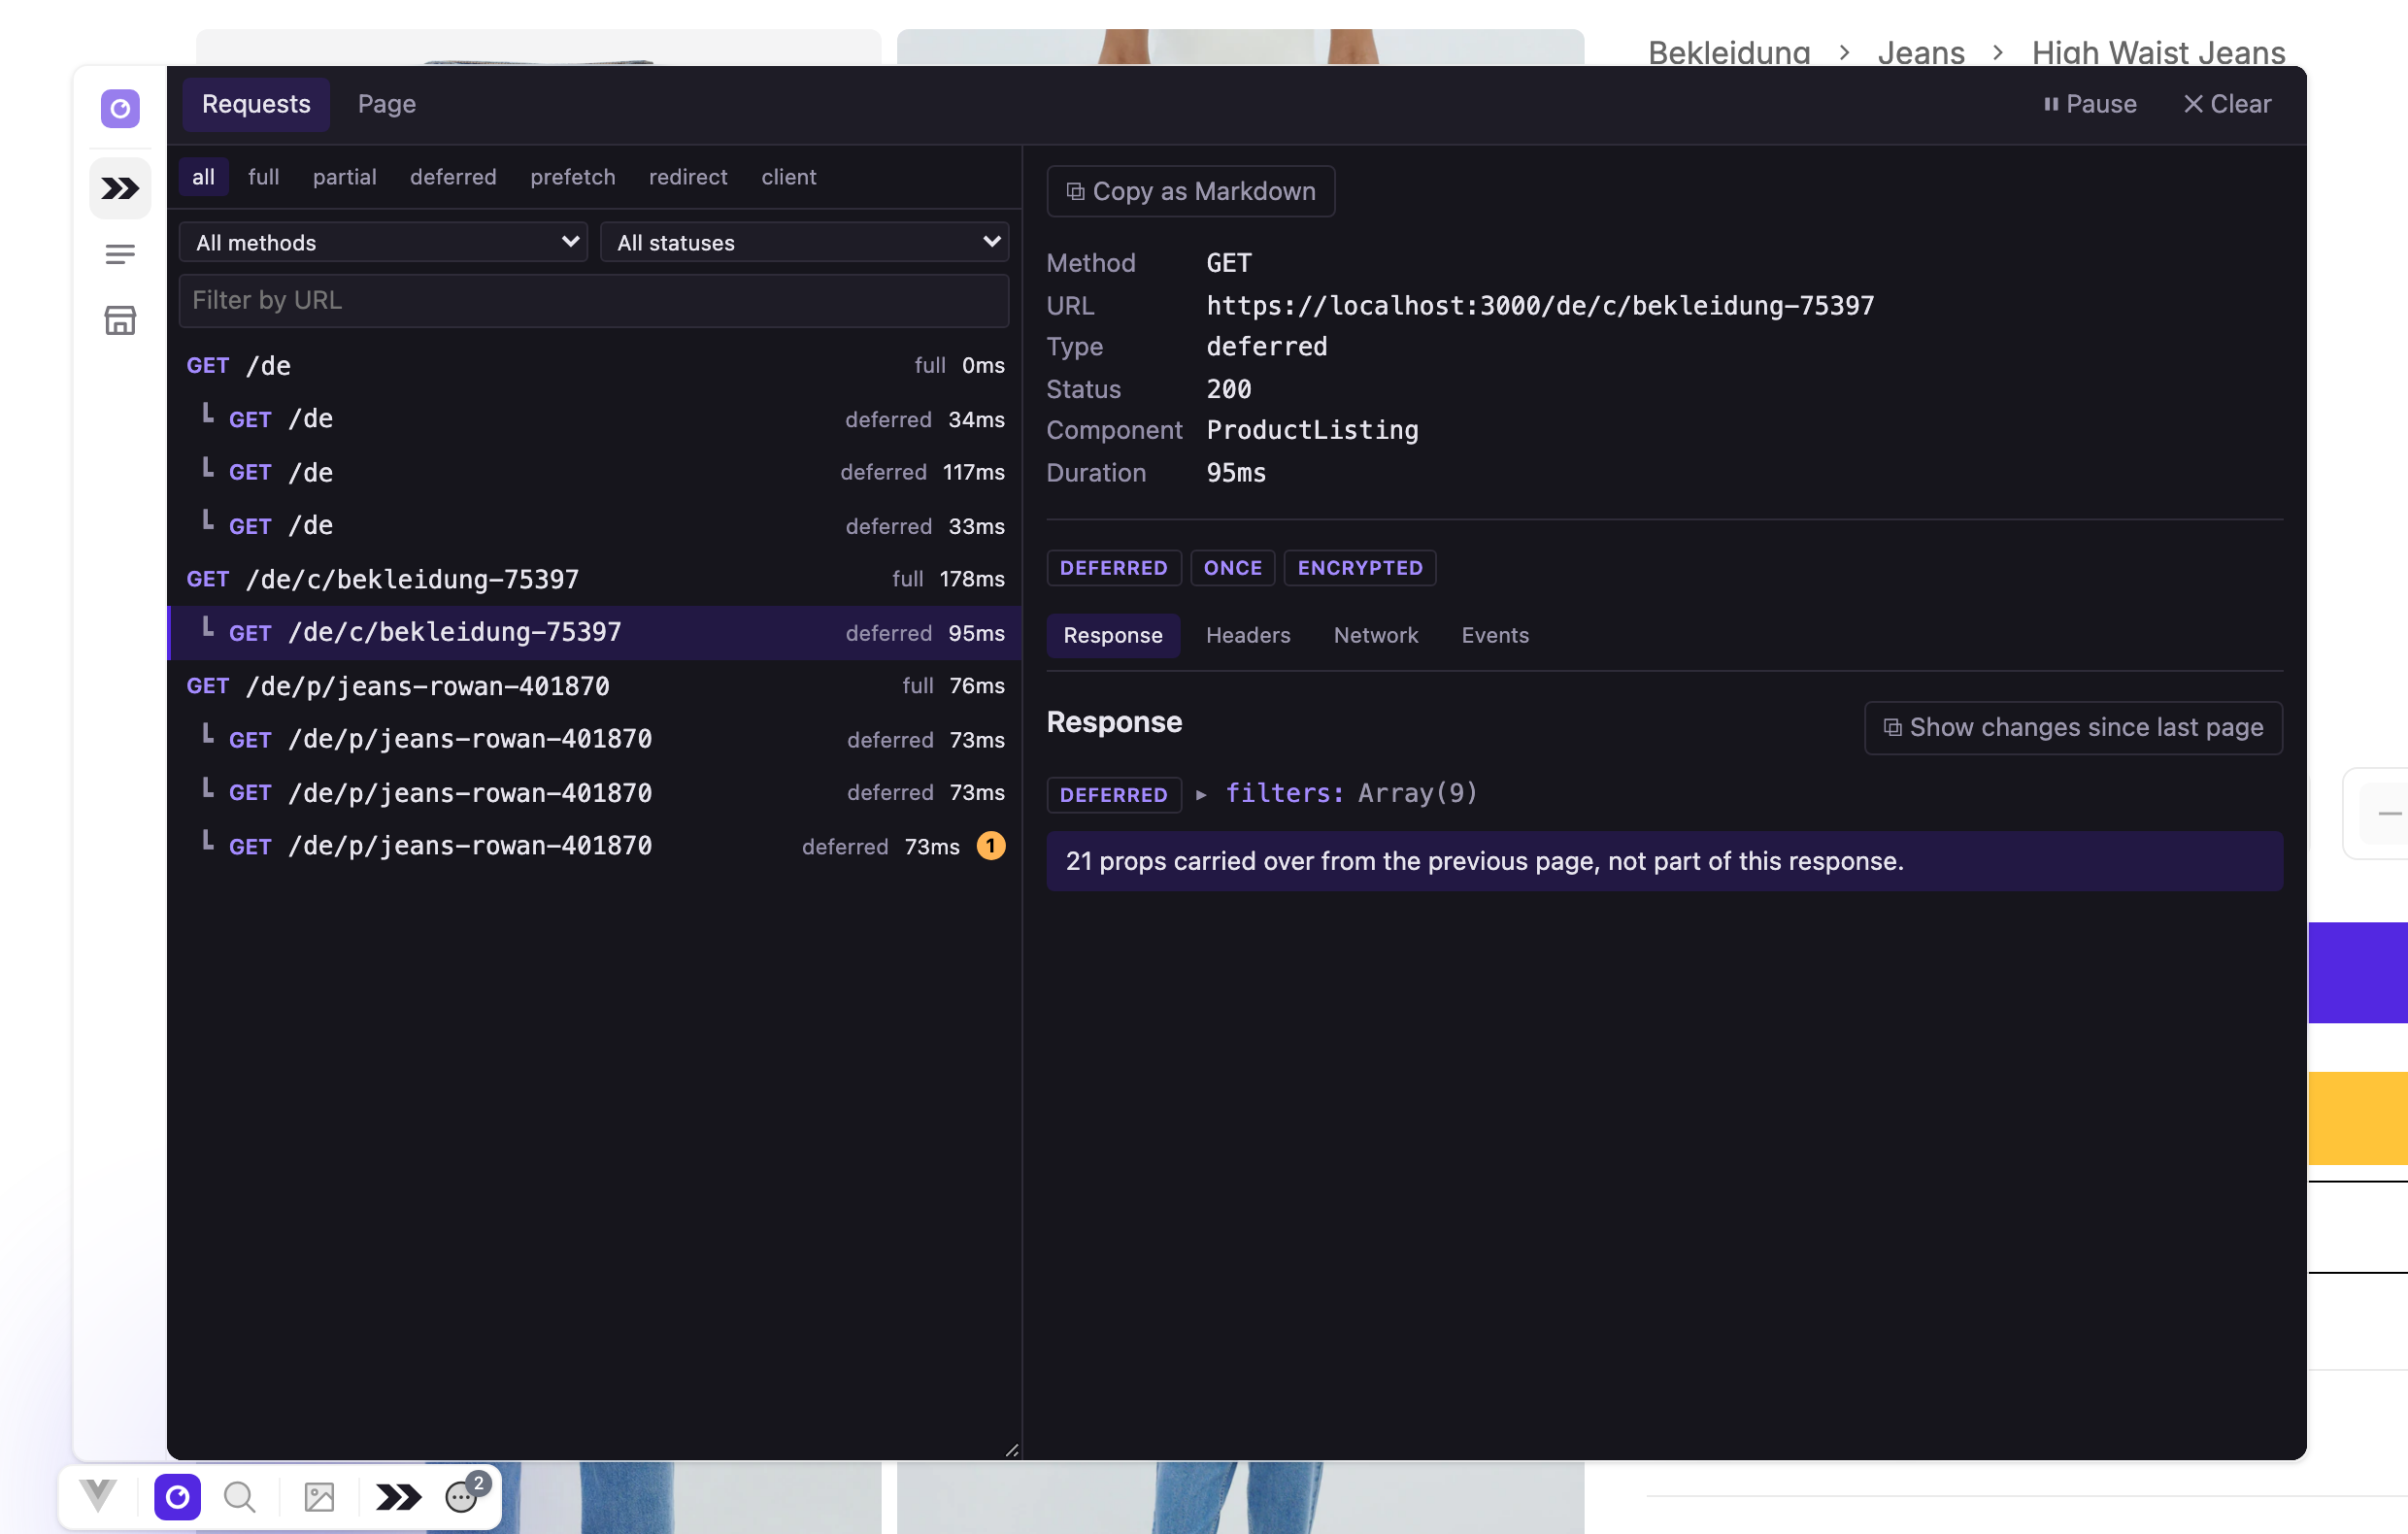
The first page load has no response body and no headers, because it arrives inside the HTML. The Headers and Response tabs fill in for visits that go through XHR.
A diagnostic flags a mistake on the visit it happened on:
- An asset version mismatch, as Inertia's
inertia:locationevent reports it. - A prop you requested with
onlythat the page does not carry after the visit. - Validation errors lost because
onlydid not includeerrors. - Deferred props that failed to load.
- A canceled or interrupted visit, and a visit that replaces the history entry instead of adding one.
The version mismatch, the missing prop, the filtered validation errors, and the failed deferred props are warnings or errors. Each also appears as a toast on the page and collects in the Messages dock, so you see it without opening the panel. A rule shows once per visit, and the toast names the rule, the request method, and the path. Its Open Inertia Panel button opens the panel. Toasts show once you have authorized the dock in that browser. The other diagnostics stay in the panel. They catch mistakes in visits that happen, so they do not replace tests for visits you never trigger.
oRPC panel
The panel answers which procedures a page called and what came back. It lists the fetch requests your browser sends to your /api endpoint, the ones described in RPC API, and not the other images, scripts, and requests a page loads. Calls made while the server renders a page run in the same process without an HTTP request, so they never show up here.
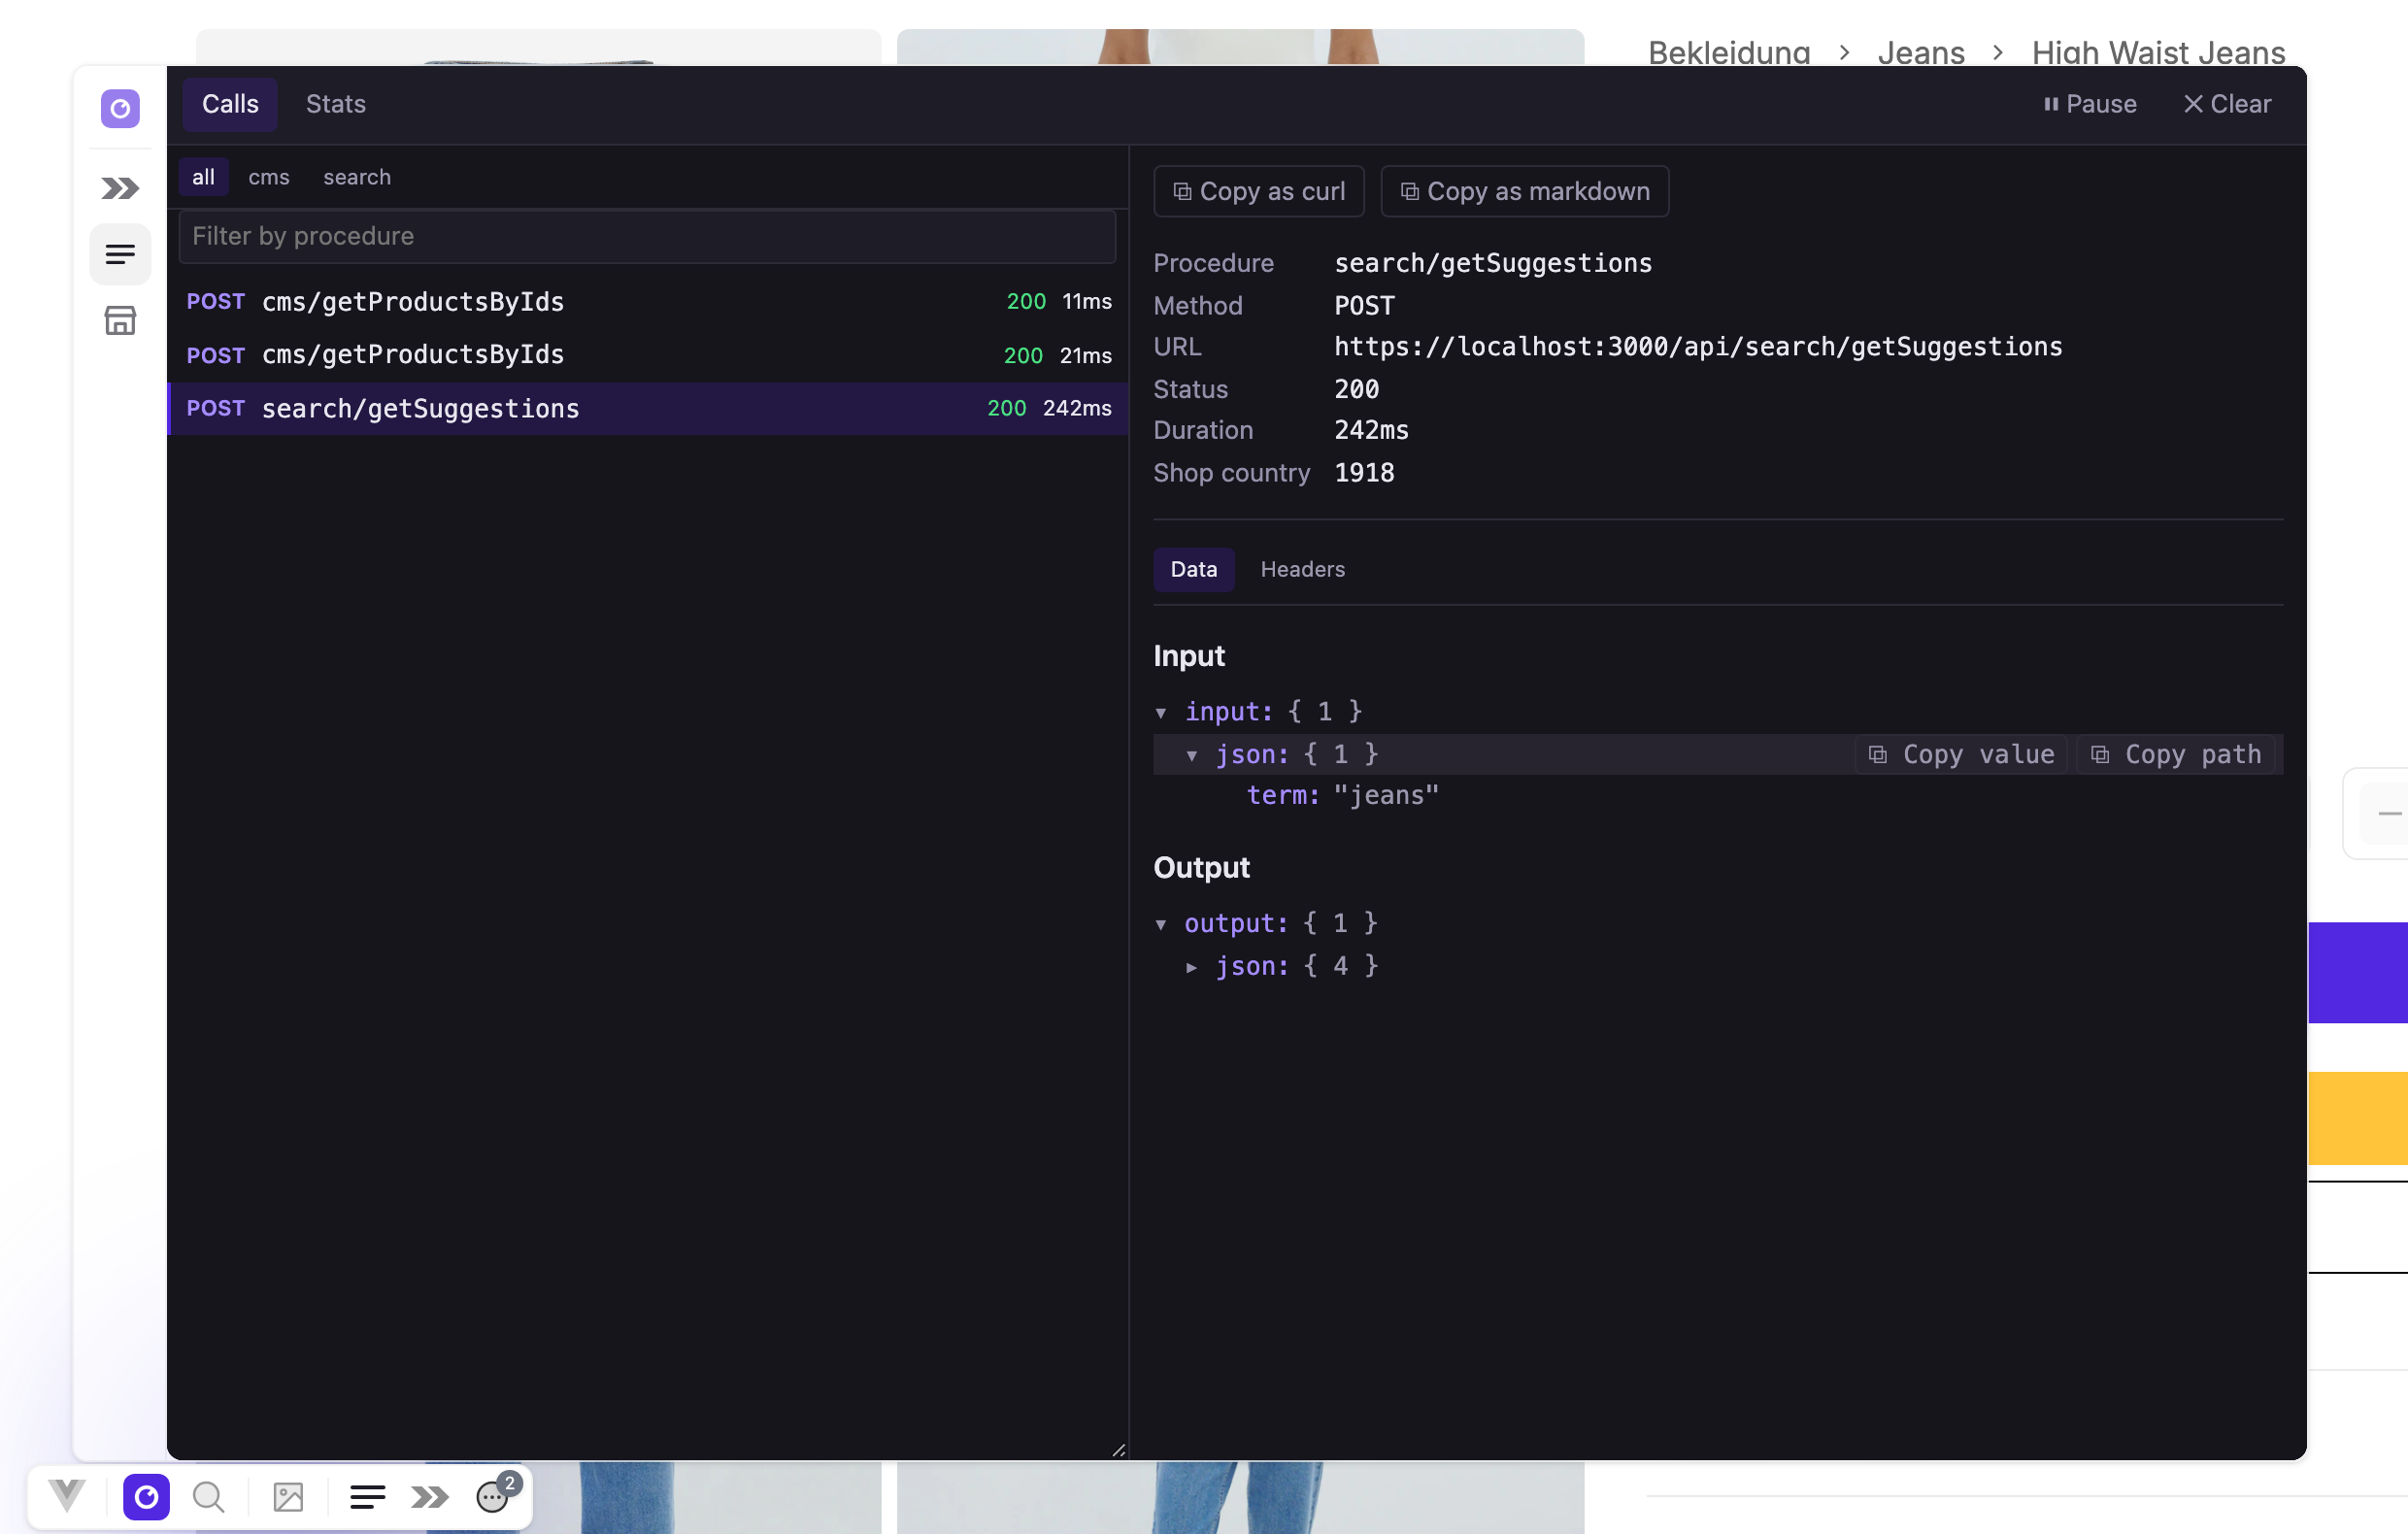
The Calls tab shows each call with its method, procedure such as basket/add, a status badge, and the duration. Filter by domain, which is the first segment of the procedure name, or type to match a procedure. Select a call to open its Data tab and its Headers tab. The Data tab shows input and output as trees. A failed call shows its oRPC code, status, message, and data instead. A toggle switches an input or output to the raw { json, meta } envelope when the decoded value differs, for example because it holds a Date or a Map.
The panel classifies each failure as a validation error (a 422 response or an INPUT_VALIDATION_FAILED body), a network error (a fetch that threw), or a server error. Copy as curl copies the method, the URL, and the decoded input as a curl command. It adds no x-csrf-token header, no X-Shop-Country-Id header, and no session cookie, and it sends the decoded input, not oRPC's { json, meta } envelope, so /api rejects it until you add those. Copy as markdown copies the call for an issue.
The Stats tab lists every procedure among the calls still in the list, with its call count, error count, average duration, and last duration. Sort by count to find the procedure a page fires ten times, or by average to find the slow one.
Storefront context panel
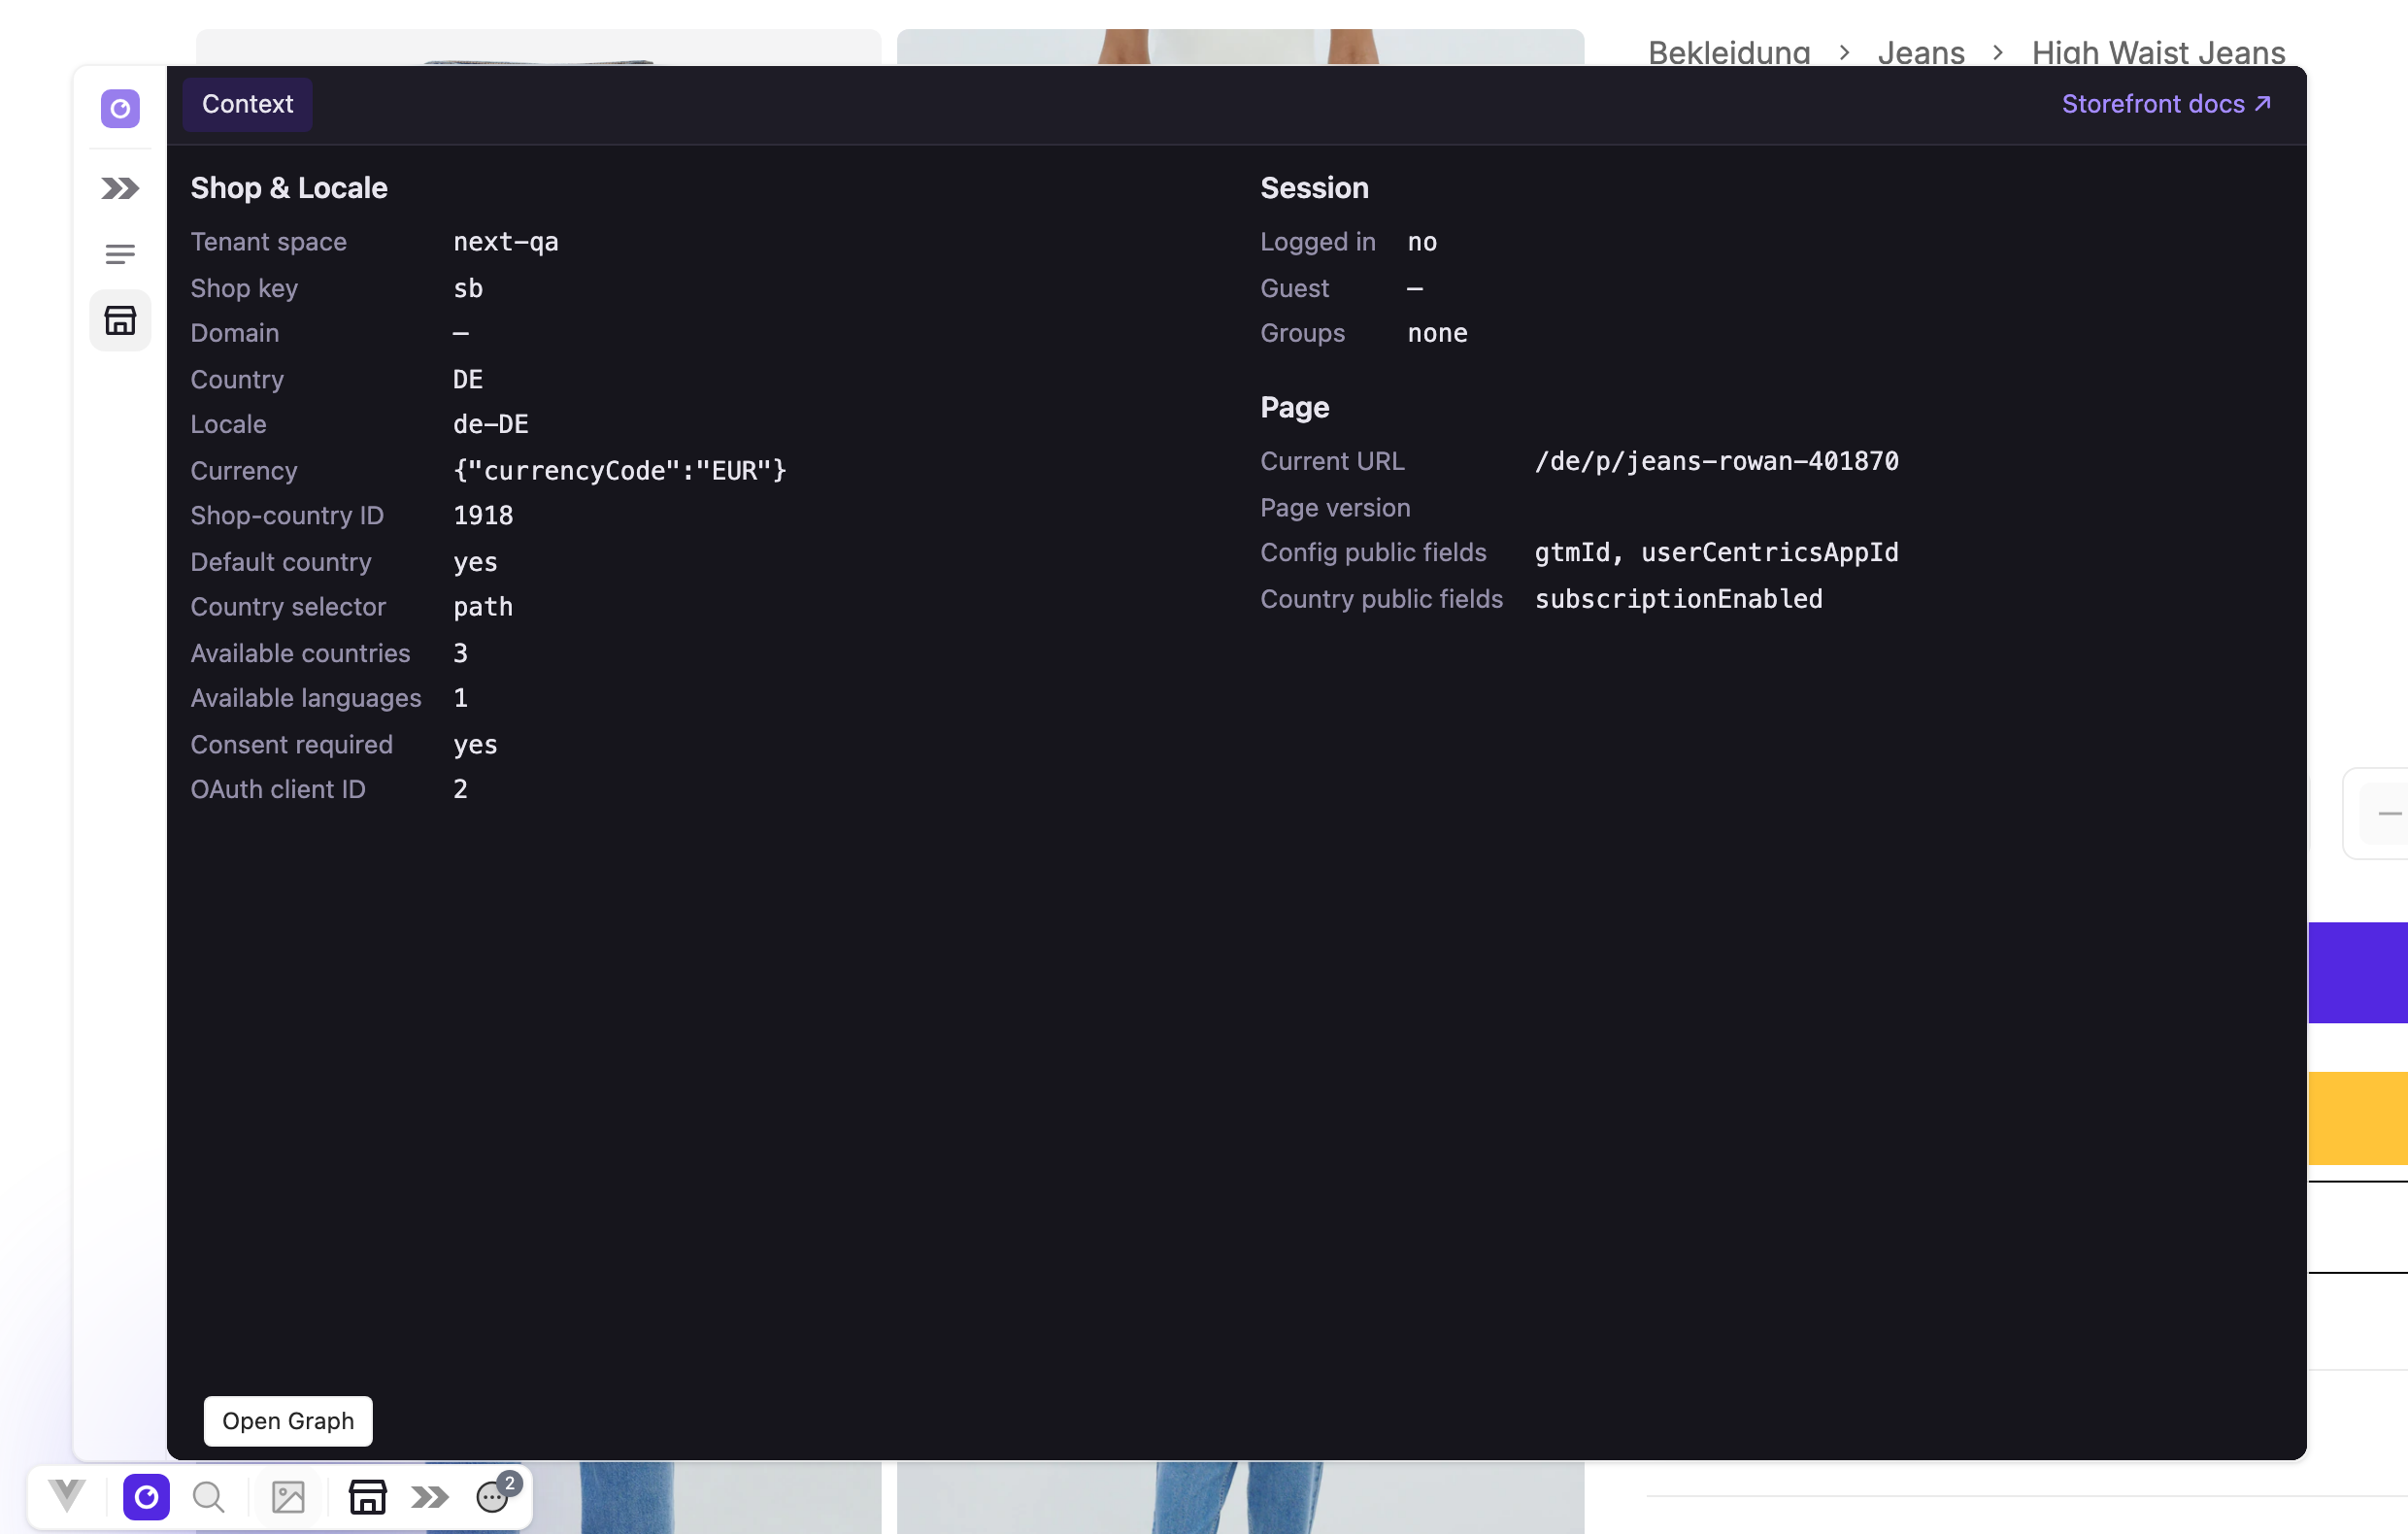
The panel answers which shop, country, and locale a request resolved to. It reads the Inertia page your app already sends and shows a read-only summary: the tenant space, shop key, country code, locale, currency, shop country ID, whether the country is the default, the country selector mode, the number of available countries and languages, whether consent management is required, the OAuth client ID, the current URL, the page version, and the key names of the public fields.
The summary uses an allowlist, so it shows no customer email or name and no session token.
The panel also has Logged in, Guest, and Groups rows. They read a user prop that the Storefront Application V3 does not share, because the application shares the session customer as customer. In the Storefront Application V3 they show no, a dash, and none, even for a signed-in customer. The Domain row has the same cause and always shows a dash.
Open Graph viewer
The viewer answers how a link to the current page looks when someone shares it. It lists the title, description, canonical link, other link tags, and the og:* and twitter:* tags, flags the tags a link preview would miss, and draws the card the way Twitter, Facebook, LinkedIn, and Telegram show it. An alternate link shows its URL but not its hreflang code. Its URL field follows the page in your app. Enter another path to inspect that page instead.
The dev server fetches the URL with Node's fetch and parses the HTML it gets back. You see what your controllers render into the server response, as a signed-out visitor receives it, because the request carries no cookies. The cards are drawn from the tags. A real crawler can still show something else, for example a card it cached earlier.
Vue DevTools
The Vue DevTools entry is the full Vue DevTools UI. It covers the component tree with props and setup state, the timeline, the inspectors that Vue plugins register, and a Select component in the page picker. Do not add vite-plugin-vue-devtools to your own Vite config, because this package already does.
The Pages tab lists Vue Router routes. The Storefront Application V3 routes on the server and has no Vue Router, so the tab stays empty.
Vite Inspect
Inspect answers what Vite did to a module. It lists every module Vite has loaded since the dev server started, with the plugins that touched it, and switches between the client and ssr environments. Pick a module to see its code after each plugin's load and transform step, with a diff to the step before.
Part of what the Storefront Application V3 runs never appears in your source files. @scayle/storefront-build turns storefront.config.* into the virtual:storefront-config module, the CMS_PROVIDER setting points the CMS aliases at one provider, and the DevTools package prepends its page scripts to src/client/main.ts. Inspect shows the result per module. It also shows when a server-only import reaches the client graph.
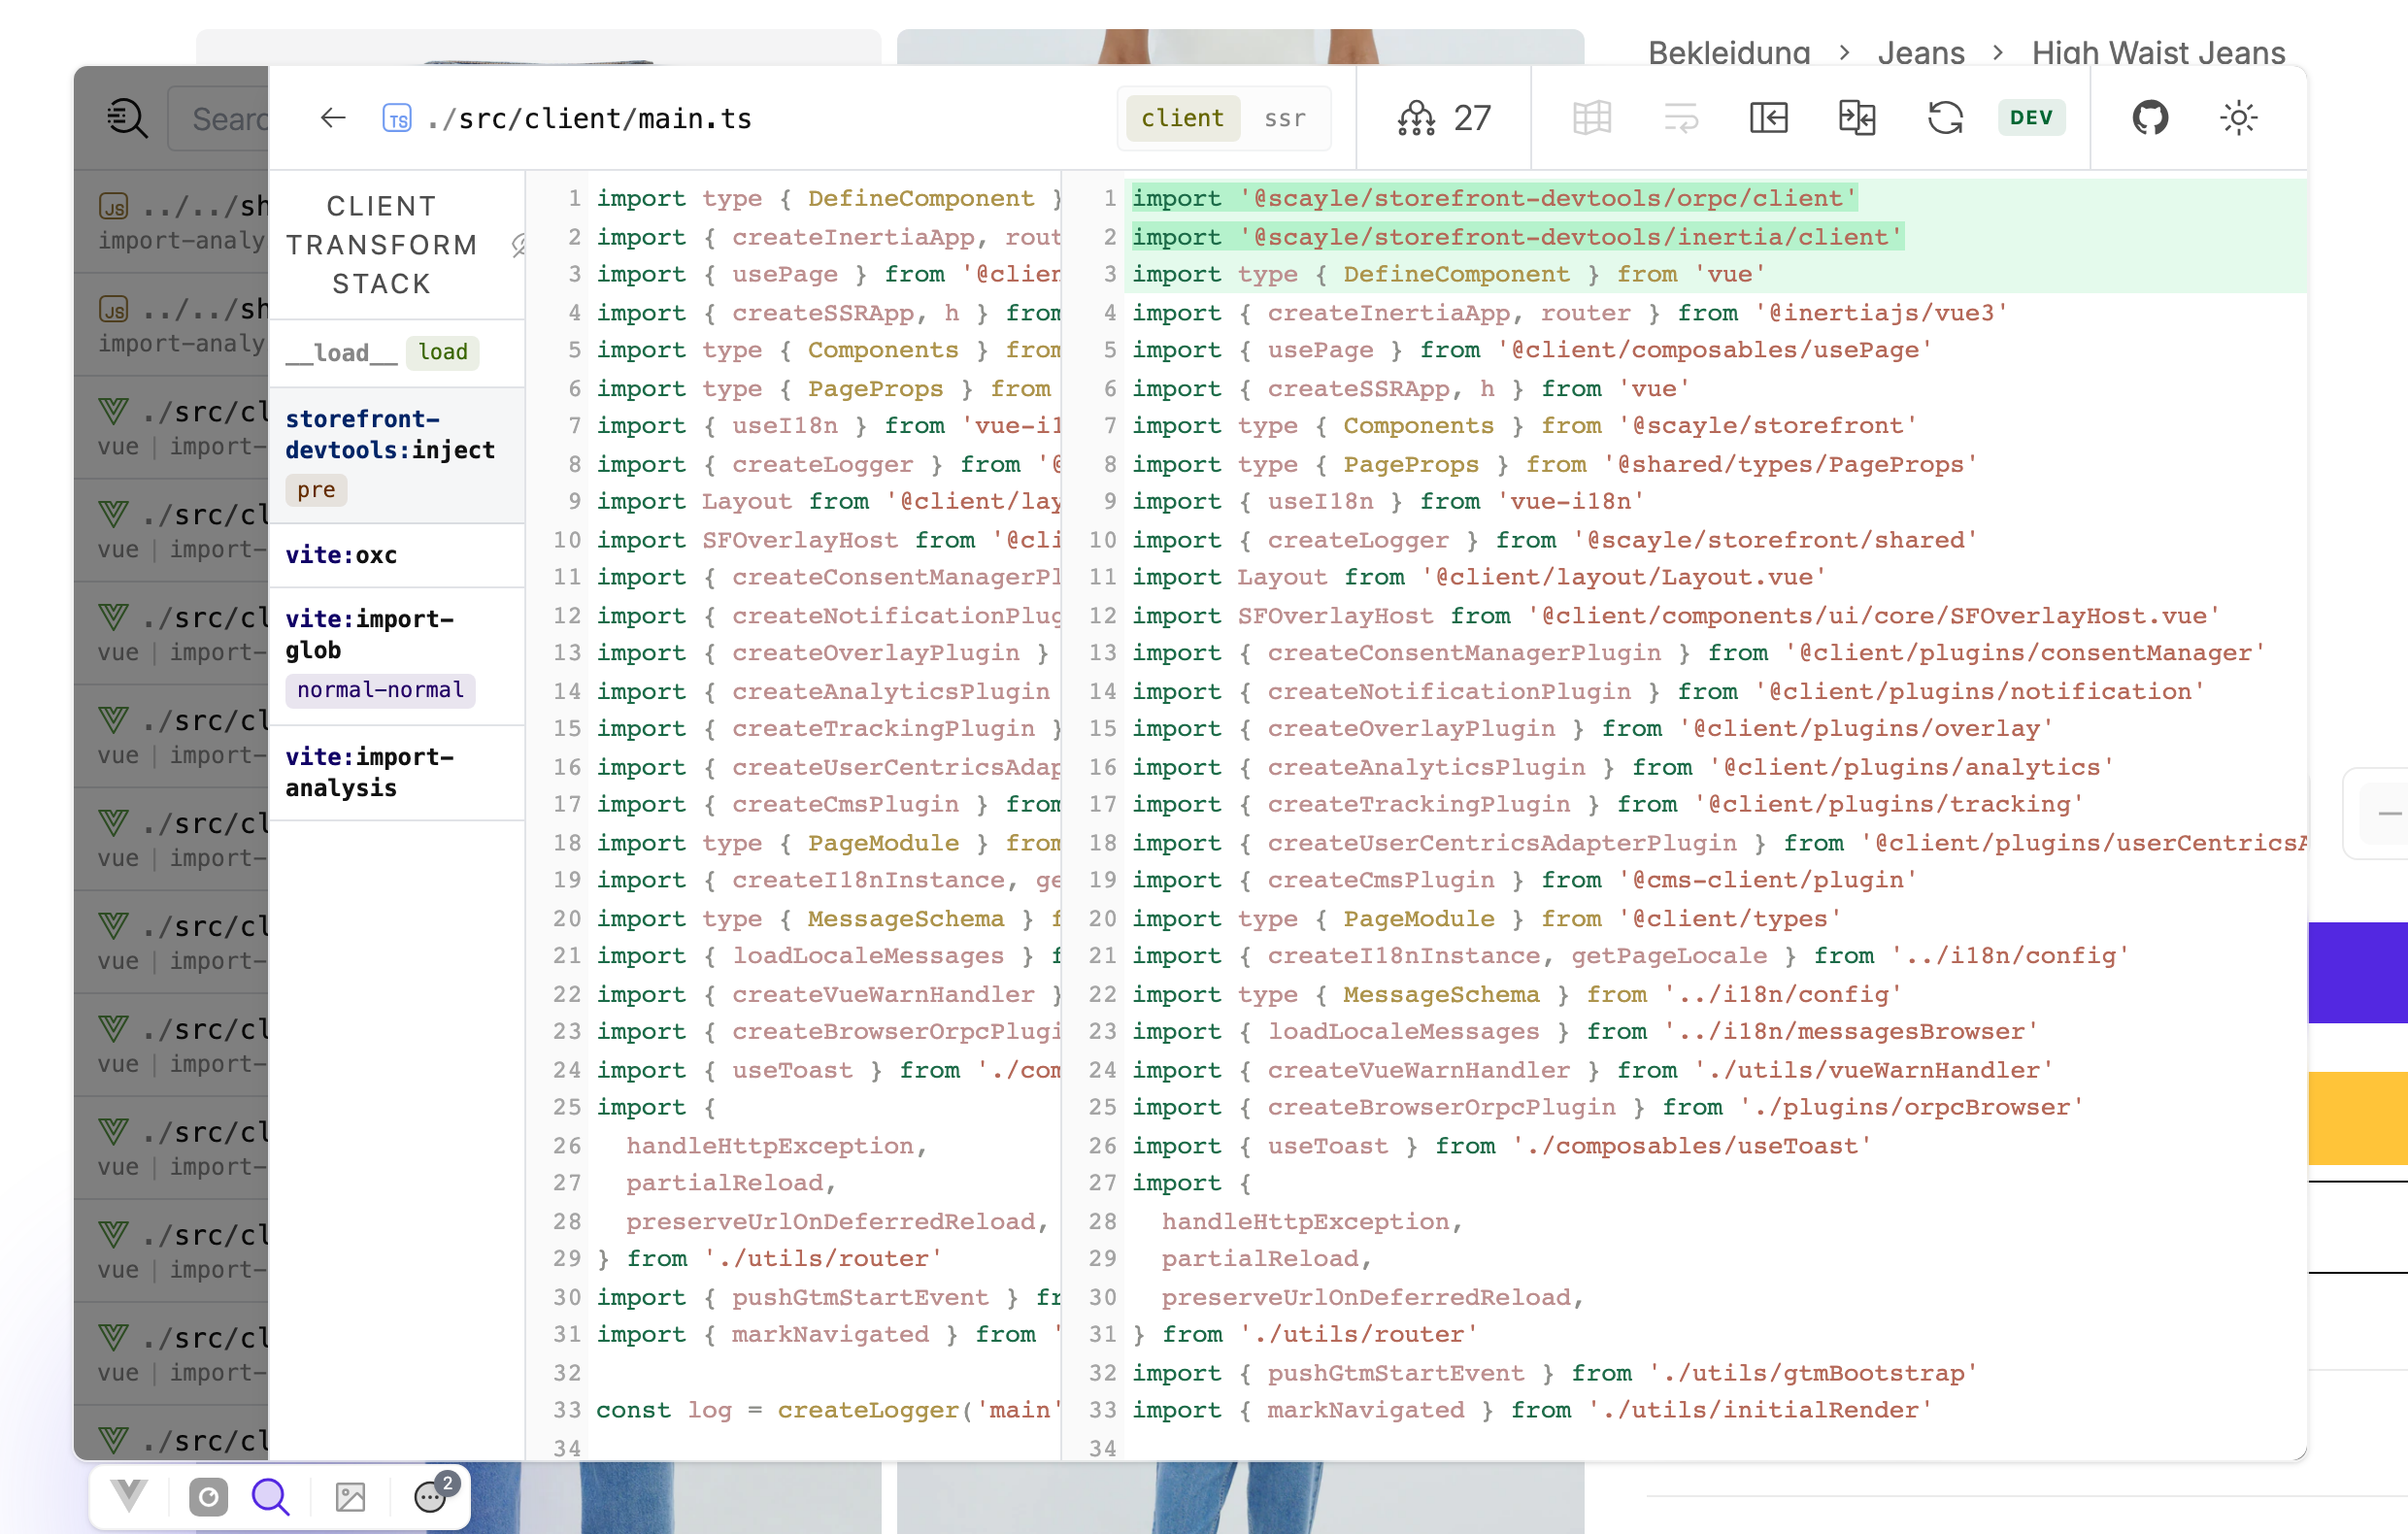
Inspect answers build and transform questions only. For page props, the session, and the requests your app sends, use the panels above. Inspect keeps the output of every plugin step in the dev server's memory for the whole session, whether you open the entry or not. To turn it off, filter it out of the plugins that storefrontDevtools() returns, wherever you spread them in vite.config.ts:
Configuration
storefrontDevtools() registers every panel. Its only options are the two dock connection options below. Set them on storefrontDevtools() and leave Vite's own devtools option unset. The package registers the dock itself, so setting devtools registers it a second time and Vite stops with DTK0034.
allowedOrigins: Origins the dock may connect from, in addition to loopback addresses.clientAuth: Set tofalseto skip the one-time code. The default istrue.
A browser connects to the dock only when its page origin is a loopback address (localhost and its subdomains such as dev.localhost, 127.0.0.1 and the rest of 127.0.0.0/8, or ::1) or an entry in allowedOrigins. The check reads the hostname and does not resolve DNS or read your hosts file, so a name that points at loopback through /etc/hosts, a reverse proxy, or a tunnel is rejected by default. Add its origin to allowedOrigins:
Either clientAuth: false or the environment variable VITE_DEVTOOLS_DISABLE_CLIENT_AUTH=true turns the one-time code off. Upstream warns that without the code, any browser that reaches the dev server can access the server and its file system. That includes other devices when server.host binds to a network interface.
What the panels capture and hide
The Inertia.js, oRPC, and Storefront panels hide values that sit under a credential-like key name. Every captured value passes through one redaction rule before it is stored. A value whose key name contains password, passphrase, secret, token, jwt, credential, authorization, cookie, api-key, or session-id (also api_key, apikey, session_id, and sessionid, in any case) shows as [redacted]. The rule covers page props, flash data, form data, response props, and oRPC input and output. A header with such a name does not appear in the captured headers. The oRPC panel also redacts the code input of auth/exchangeAuthCode, because that value is an OAuth code and a bare code key is not sensitive on other procedures. Copy as Markdown and Copy as curl use the redacted values, except that Copy as Markdown includes the errors bag of a failed visit as sent.
Redaction matches key names only. A credential inside a value, such as a token in a URL query string, is not detected, and the copied URL keeps it. A key inside a Map is not matched either. A prop whose name matches shows as [redacted] even when it holds harmless data. A prop called token or cookieConsent is one example. Rename the prop if you need to read it in the panel.
Validation messages are the one exception. The Events tab shows the errors bag of a failed visit as sent, so a message such as "Must be 8 characters" stays readable. The same bag inside the page props follows the key rule, so errors.password shows as [redacted] in the Response and Page tabs.
The rule covers the three Storefront panels. Vue DevTools and Vite Inspect are upstream tools. They show what they show, including component props and setup state, and the request URLs with query strings that Inspect lists in its metrics view.
Constraints and limits
Permanent
- The dock runs on the dev server only. Nothing from it reaches a production build: no dock, no page scripts, and no launcher. The package does not turn on the upstream build-time injection options.
- The panels capture what the browser does. Inertia.js visits and oRPC calls that your browser made appear, and calls made while the server renders a page do not. The oRPC panel also skips the
spec.jsonanddocspaths. - Each browser tab keeps its own capture, so the Inertia.js and oRPC panels of two open tabs never share visits or calls. Diagnostic toasts and the Messages dock are the exception, because the dev server keeps one message feed for every connected tab.
Known limitations
- The Storefront context panel shows no real values in its Logged in, Guest, Groups, and Domain rows. The cause is in Storefront context panel.
- Each list keeps the latest 200 entries: 200 Inertia.js records, which include client visits and prefetches, and 200 oRPC calls. Past that, the oldest finished entries drop.
- Past 100 events, a visit drops its oldest upload
progressevents. - A captured value is cut at 10 levels of depth. Deeper values show as
[too deep]. - After a reload, a Previous session block keeps a short summary of each earlier visit or call. It stays for five minutes after the last captured activity.
- After a reload, the Open Inertia Panel button of an older toast or Messages dock entry does nothing until you have opened the SCAYLE Storefront group once in the new page. An entry sent before the panel first loaded can open the oRPC or Storefront tab you picked last instead of the Inertia.js tab.
- The Open Graph viewer renders the page a second time on the dev server whenever the app's URL changes while its URL field follows the page. Close it before you trace or profile a request.
- The Open Graph viewer cannot follow the page in the dock's Popup mode. Enter an absolute URL, or switch back to Float or Edge mode.
- The Open Graph viewer's suggestions include a Nuxt snippet tab that does not apply to the Storefront Application V3. Set missing tags in the page meta that your controller builds.
Troubleshooting
The dock does not connect
Issue: The launcher appears, but the dock cannot reach the dev server, and you opened the storefront on a custom dev hostname.
Possible causes:
- The page origin is not a loopback address and not in
allowedOrigins, for example a hostname from/etc/hosts, a reverse proxy, or a tunnel.
Solution:
- Add the origin to
allowedOrigins, as shown in Configuration. - Restart
pnpm dev, because Vite reads the option at startup. - If the dock now asks for a code, enter the code that the
pnpm devterminal prints, or open the link next to it.
Prevention: Use localhost for day-to-day work, and add an allowed origin only for other hostnames.
The Open Graph viewer reports unable to verify the first certificate
Issue: The viewer shows the certificate error instead of the page's meta tags.
Possible causes: The dev server fetches the page with Node, and Node ignores the system certificate store by default. The mkcert root certificate that signed your local certificate lives in that store, so the Node process does not trust it.
Solution: Start the dev server with NODE_USE_SYSTEM_CA=1 pnpm dev. Alternatively, set NODE_EXTRA_CA_CERTS to the path that echo "$(mkcert -CAROOT)/rootCA.pem" prints. Don't set NODE_TLS_REJECT_UNAUTHORIZED=0, because it turns off certificate checks for every outgoing request.
Prevention: Set the variable in the shell profile you start pnpm dev from.


